USD/JPY Price Analysis: Bears to target 38.2% ratio near 110.17 ahead of 110.10
- USD/JPY is meeting channel resistance near 110.80 and eyes are on the downside.
- Hourly bearish divergence opens the risk of a break of critical hourly support.
The price of USD/JPY is technically expensive relative to the W-formation's neckline and the daily channel. The following illustrates where a downside opportunity could present itself according to the market's structure.
USD/JPY daily chart
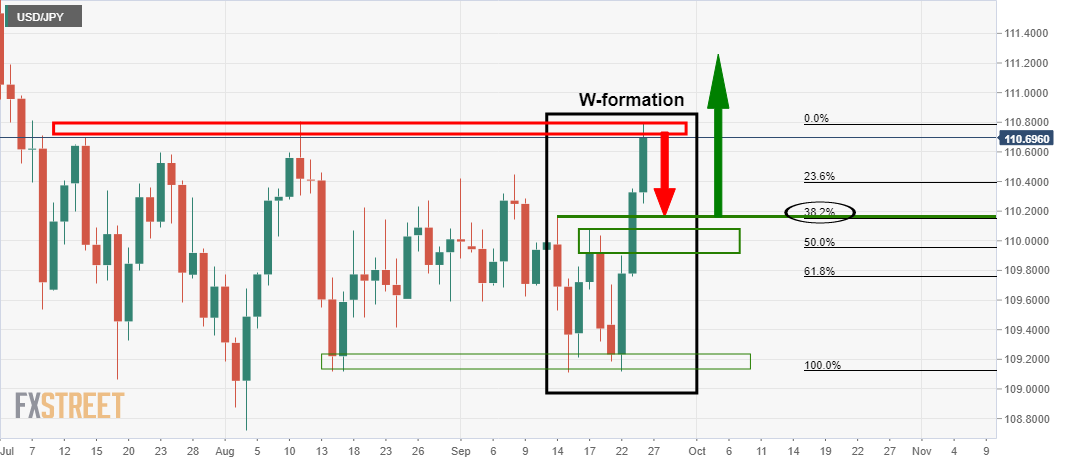
The W-formation, as a reversion pattern, has a high completion rate to the neckline. In this case, the neckline comes in at 110.10. Before there, however, there is prior resistance that has a confluence with the 38.2% Fibonacci level that could offer some support o the way there. This comes in at 110.17.
USD/JPY hourly bearish divergence
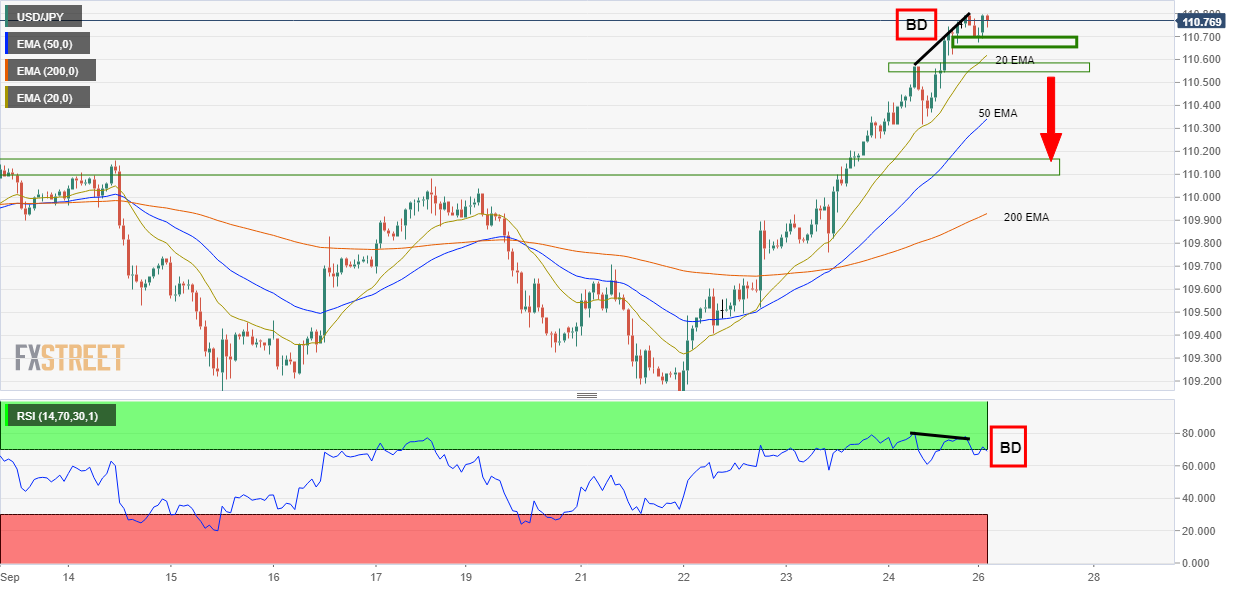
The hourly bearish divergence of the RSI adds conviction to the downside bias. However, the bears would be prudent to wait for the price action to play out to the downside before engaging at an optimal price entry. A break of the support near 110.57 and below the 20 EMA would be significant and bearish.