US Dollar Index Price Analysis: Six-month-old hurdle probes DXY bulls at yearly top below 94.00
- DXY bulls take a breather after three-day uptrend to 10-month high.
- RSI conditions, resistance line from March-end challenge bulls.
- 78.6% Fibonacci retracement restricts the pullback moves before monthly support line.
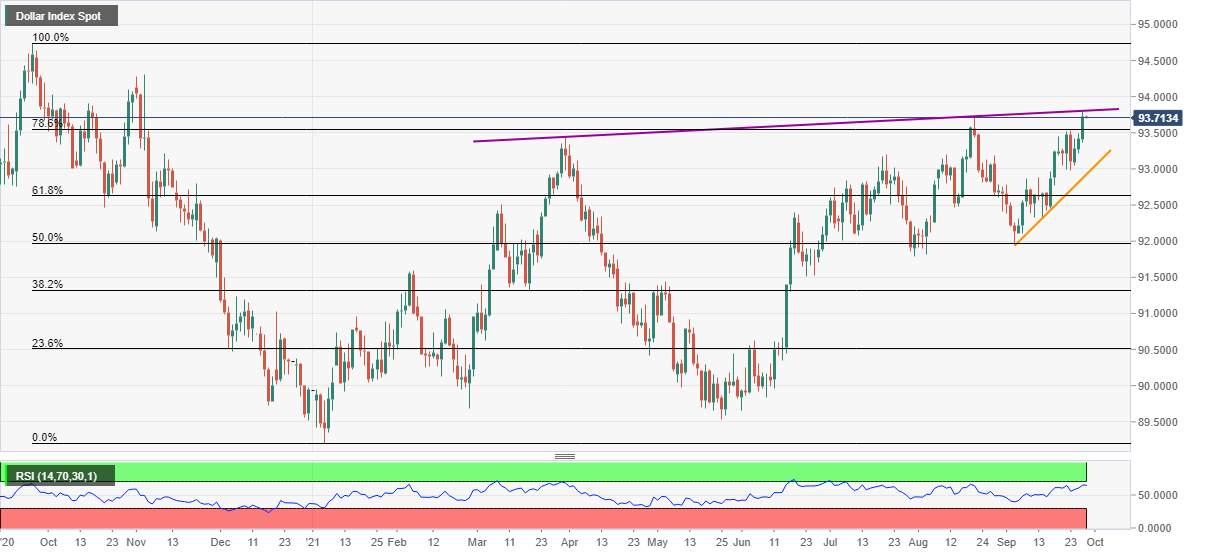
US Dollar Index (DXY) eases to 93.71 following its three-day uptrend to refresh the yearly high.
The greenback gauge struggles below an ascending resistance line from March 31 amid nearly overbought RSI conditions, suggesting pullback moves towards the 78.6% Fibonacci retracement (Fibo.) of September 2020 to January 2021 downside, near 93.55.
It should be noted, however, that the quote’s weakness past 93.55 will be challenged by Thursday’s low surrounding the 93.00 threshold and an ascending trend line from September 03, near 92.90.
In a case where the US Dollar Index remains weak below 92.90, the 61.8% Fibo. level near 92.60 should return to the charts.
On the flip side, a daily closing beyond the stated resistance line of around 93.80 will be needed for the DXY bulls to keep controls.
Following that, the 94.00 round figure may entertain DXY bulls before directing them to the November 2020 high of 94.30.
DXY: Daily chart
Trend: Pullback expected