AUD/NZD Price Analysis: Approaches 1.0550 despite an RBNZ interest rate hike
- The New Zealand dollar has been downward pressured, despite the RBNZ hike rate.
- Risk appetite improved on good US geopolitical and domestic issues.
- From a technical perspective, the AUD/NZD is tilted to the upside.
The AUD/NZD is advancing for the third consecutive day, is changing hands at 1.0523, posting a minimal gain of 0.05% at the time of writing.
On Wednesday, the RBNZ hiked interest rates by 25 basis points to the Overnight Cash Rate to 0.50%. Despite increasing rates, the New Zealand dollar fell across the board on the famous saying, “buy the rumor, sell the fact,” meaning that the hike was priced in by the market.
The market sentiment is upbeat, portrayed by Asian equity futures rising between 0.21% and 0.97%. Positive news concerning the US debt ceiling issues improved the mood right at the New York close. Further, ongoing conversations between the US and China added to the risk-on appetite.
Concerning debt ceiling chatters, the US Republican Senator and leader of its party, Mitch McConnell, agreed to offer a short-term debt limit increase that would last until December, according to wires.
Once the news hit the wires, US stock indices reversed their ongoing price action to finish the day in the green, gaining between 0.30% and 0.63%. Further, risk-sensitive currencies, like the Australian and New Zealand dollar, got a boost trimming some losses against the greenback as the New York session closed.
AUD/NZD Price Forecast: Technical outlook
Daily chart
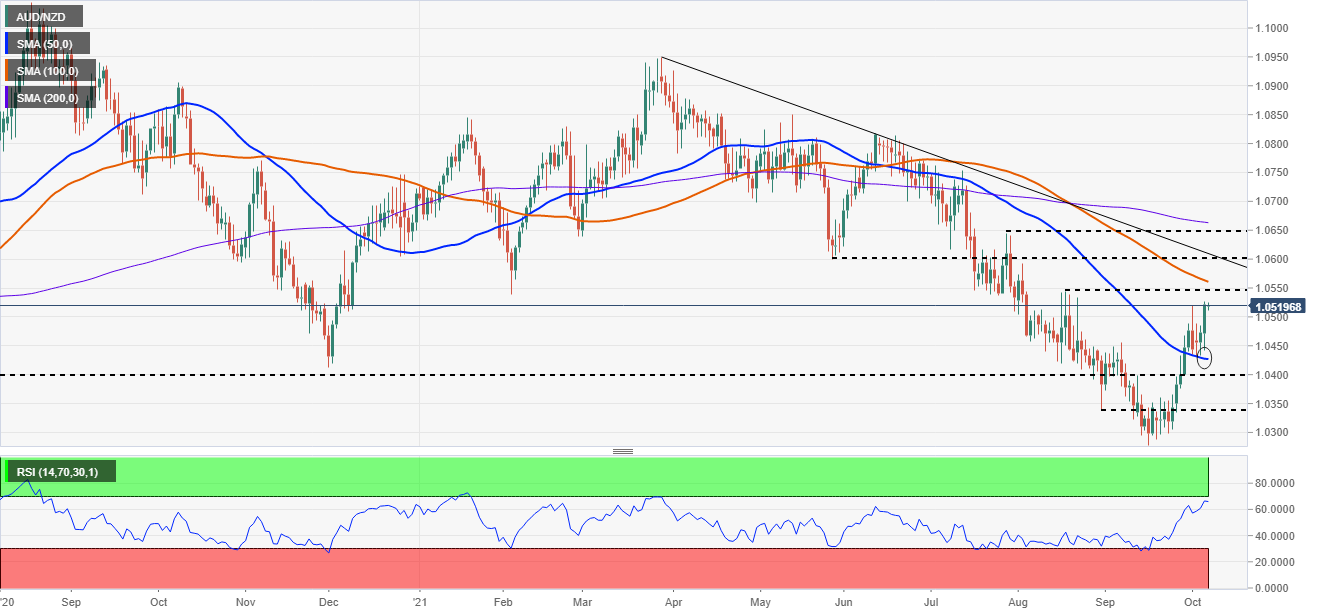
The AUD/NZD spot price is approaching the 1.0550 price level, which has been tested four previous times, unsuccessfully. For AUD/NZD buyers to regain control, they will need a daily close above the confluence of August’s 18 high and the 100-DMA around the 1.0543-1.0560 range. In case of that outcome, a move towards 1.0600 is on the cards. A break above the latter could push the AUD/NZD towards July’s 28 high at 1.0644.
On the other hand, for AUD/NZD sellers to resume the downtrend, they will need a daily close below 1.0500. Once that has been achieved, the first and immediate support level would be the confluence of October’s five low and the 50-DMA around the 1.0420-1.0430 range. A breach of that area could open a test of key support levels at the psychological 1.0400, followed by August’s 31 low, at 1.0337
The Relative Strength Index (RSI) is at 65, aiming higher, suggesting that another push higher might be on the cards.
KEY ADDITIONAL LEVELS TO WATCH