Gold Price Forecast: XAU/USD faces a wall of resistance near $1791 – Confluence Detector
- Gold price stalls its three-day uptrend, as USD recovers ground broadly.
- Gold’s retreat remains capped by easing Treasury yields amid risk-off mood.
- Gold: Sellers defend $1,800, all eyes on US T-bond yields.
Gold price is consolidating the three-day winning streak, although the bulls appear to lack follow-through upside amid a rebound in the US dollar across the board. Mixing European earnings reports and China’s property sector woes are weighing on the investors’ sentiment, boding well for the safe-haven dollar while capping the upside in gold price. Going forward, the broader risk sentiment will continue to remain the market driver, impacting the USD valuations, in turn, gold’s.
Read: Gold Price Forecast: Will XAU/USD find acceptance above channel hurdle at $1791?
Gold Price: Key levels to watch
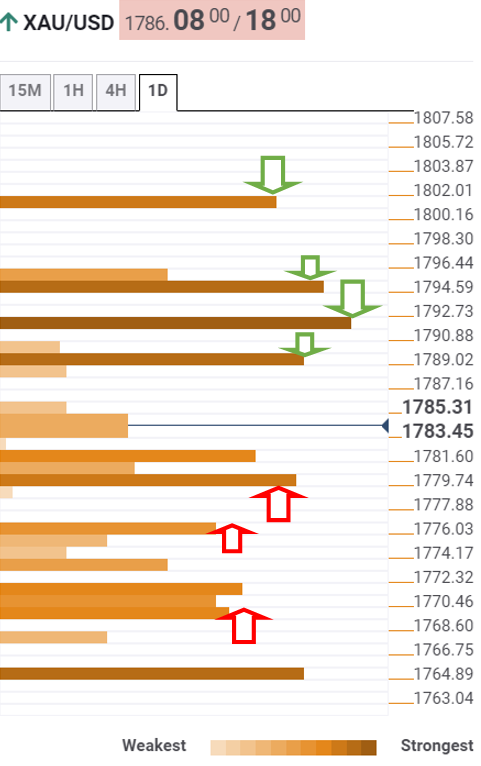
The Technical Confluences Detector shows that gold is heading back towards the daily highs of $1789, where the Fibonacci 23.6% one-week aligns.
If that barrier is crossed on a sustained basis, then gold bulls will target the next crucial resistance at $1791, the confluence of the Fibonacci 61.8% one-month and pivot point one-day R1.
Further up, gold will face another critical resistance at $1795, the convergence of the pivot point one-week R1, SMA100 and 200 one-day.
The last line of defense for gold sellers is the intersection of the previous week’s high and pivot point one-day R2 at $1801.
On the flip side, a dense cluster of support levels awaits around $1780, where the Fibonacci 38.2% one-week meets with the Fibonacci 38.2% one-day.
The next cushion is placed at $1776, the confluence of the Fibonacci 61.8% one-day and SMA5 one-day.
$1769 will challenge the bullish commitment, as the SMA10 one-day, pivot point one-day S1 SMA200 four-hour and Fibonacci 61.8% one-week coincide at that level.
Here is how it looks on the tool
About Technical Confluences Detector
The TCD (Technical Confluences Detector) is a tool to locate and point out those price levels where there is a congestion of indicators, moving averages, Fibonacci levels, Pivot Points, etc. If you are a short-term trader, you will find entry points for counter-trend strategies and hunt a few points at a time. If you are a medium-to-long-term trader, this tool will allow you to know in advance the price levels where a medium-to-long-term trend may stop and rest, where to unwind positions, or where to increase your position size.