USD/CAD Price Analysis: Keeps post BOC pullback from 1.2430 as MACD flirts with bears
- USD/CAD consolidates the heaviest daily fall in a week.
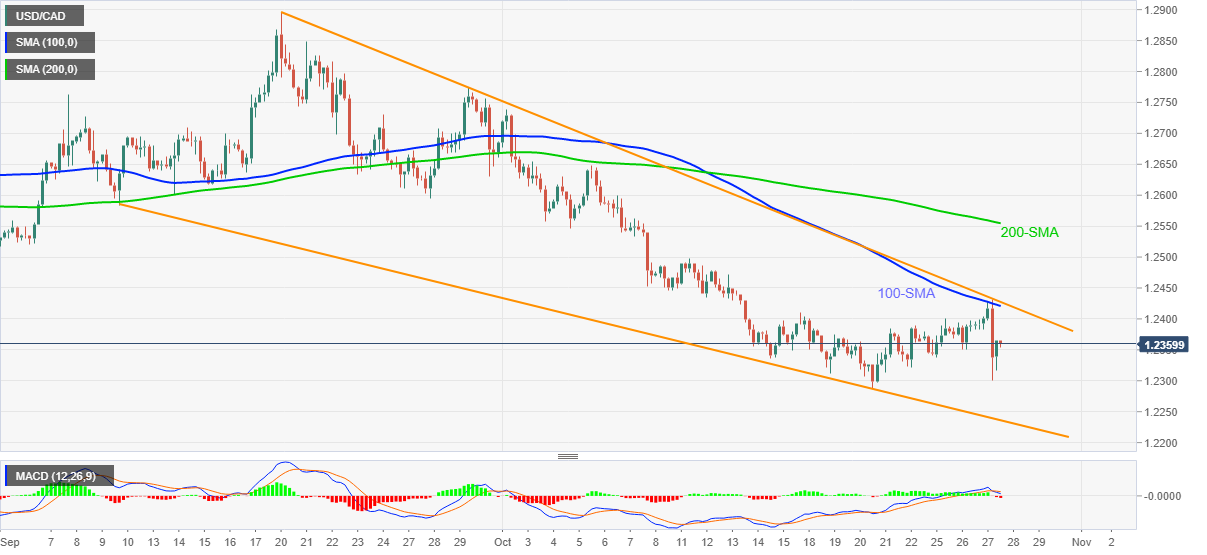
- Convergence of 100-SMA, falling wedge resistance guards immediate upside.
- Monthly low, late June’s bottom remains on seller’s radar.
USD/CAD licks the Bank of Canada (BOC) led wounds around 1.2360, keeping the bound off weekly low during Thursday’s Asian session.
The Loonie pair dropped the most in one week the previous day following the BOC’s surprise end to asset purchases.
As the corrective pullback remains below 100-SMA and the upper line of a seven-week-old falling wedge bullish chart pattern, amid bearish MACD, USD/CAD prices are likely to remain pressured.
The same will help the pair bears to aim for the monthly low surrounding 1.2290. However, lows marked during the late June and support line of the stated wedge, respectively around 1.2250 and 1.2235, can challenge the USD/CHF downside afterward.
On the flip side, the 200-SMA level of 1.2555 will probe the run-up beyond the 1.2430 resistance confluence, including 100-SMA and wedge’s upper line.
During the quote’s successful rise past 1.2555, late September highs of 1.2775 and the yearly top marked in August, around 1.2950, will gain the market attention.
USD/CAD: Four-hour chart
Trend: Further weakness expected