GBP/JPY Price Analysis: Daily support is vunerable from H1 perspective
- GBP/JPY bears are lurking below a key hourly counter trendline.
- From a longer-term perspective, a correction to the upside could be in the making.
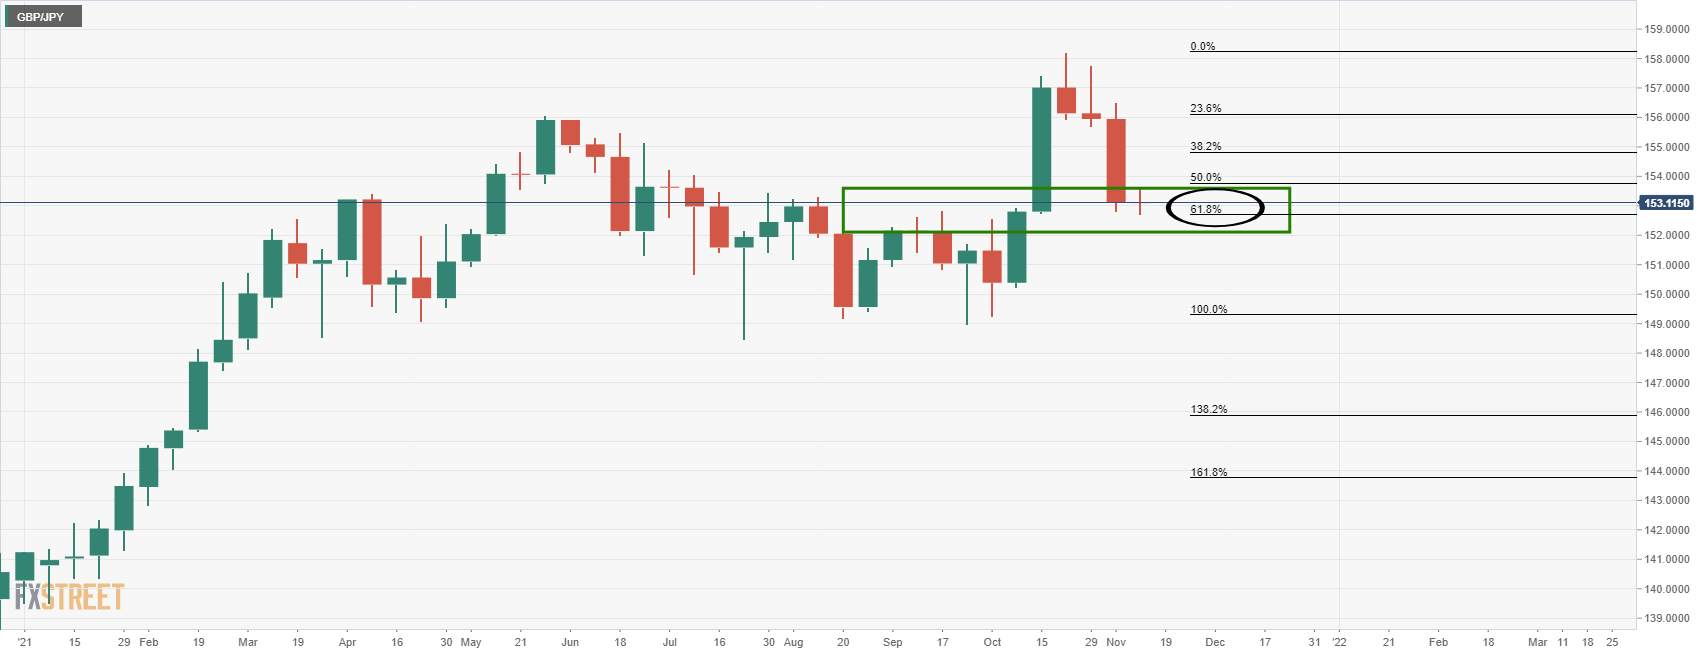
GBP/JPY suffered a heavy blow last week, dropping to almost a 61.8% Fibonacci retracement of the prior bullish impulse. At this juncture, the price is meeting the neckline of the W-formation and is starting to consolidate. This makes for tricky grounds for bears seeking a lower low on the shorter time frames, for an upside correction could be imminent. The following illustrates this from a weekly perspective:
GBP/JPY weekly chart
GBP/JPY daily chart
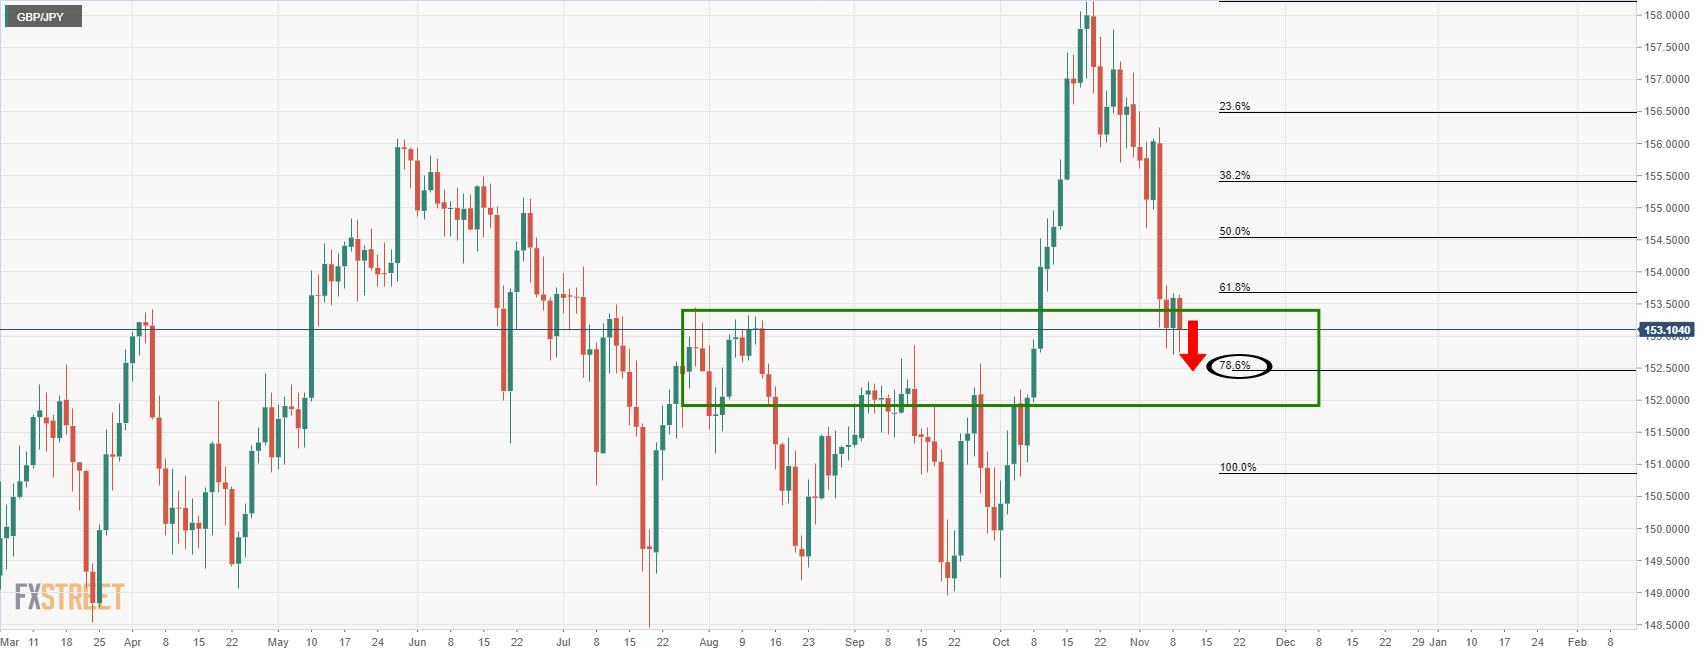
From a daily perspective, as illustrated in the chart above, the price is attempting to move lower and for a deeper test of the weekly supporting territory, but so far to no avail. However, given that it has already broken the 61.8% Fibo of the prior daily rally's range, the 78.6% Fibo located at 152.40 is in range.
GBP/JPY H1 chart
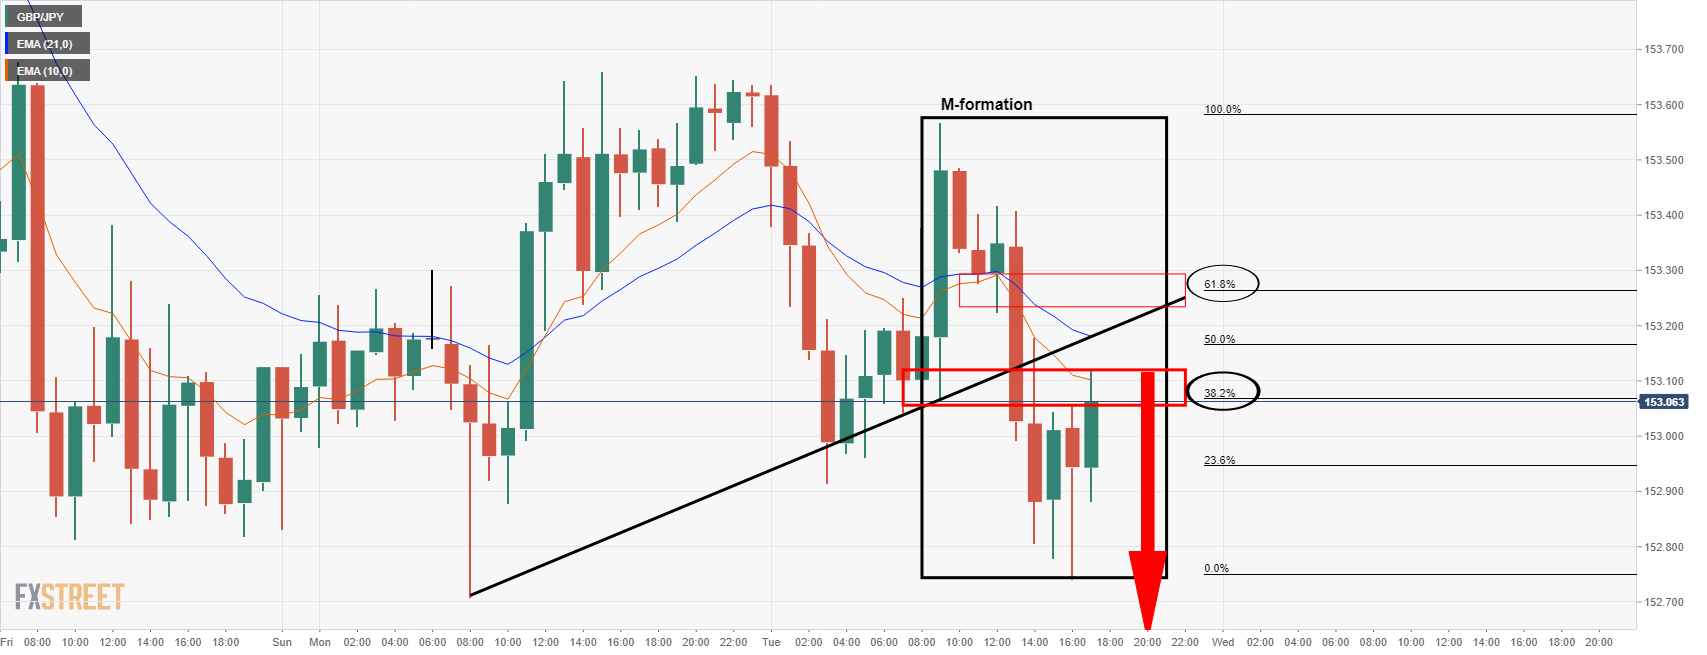
From an hourly perspective, the resistance structure is compelling around the 10-EMA and the confluence of the 38.2% Fibonacci retracement of the latest bearish impulse near 153 the figure. However, the M-formation's neckline could come under pressure should counter-trendline give-out to the correction which has a confluence of the 61.8% Fibo near 153.25. If the counter-trendline holds and bears move in, then 152.50 could be an attractive target for the downside which is a -61.8% Fibo of the current range of the latest hourly correction.