US Dollar Index Price Analysis: DXY seesaws around 16-month high on the way to 95.70
- DXY bulls take a breather after refreshing multi-day top.
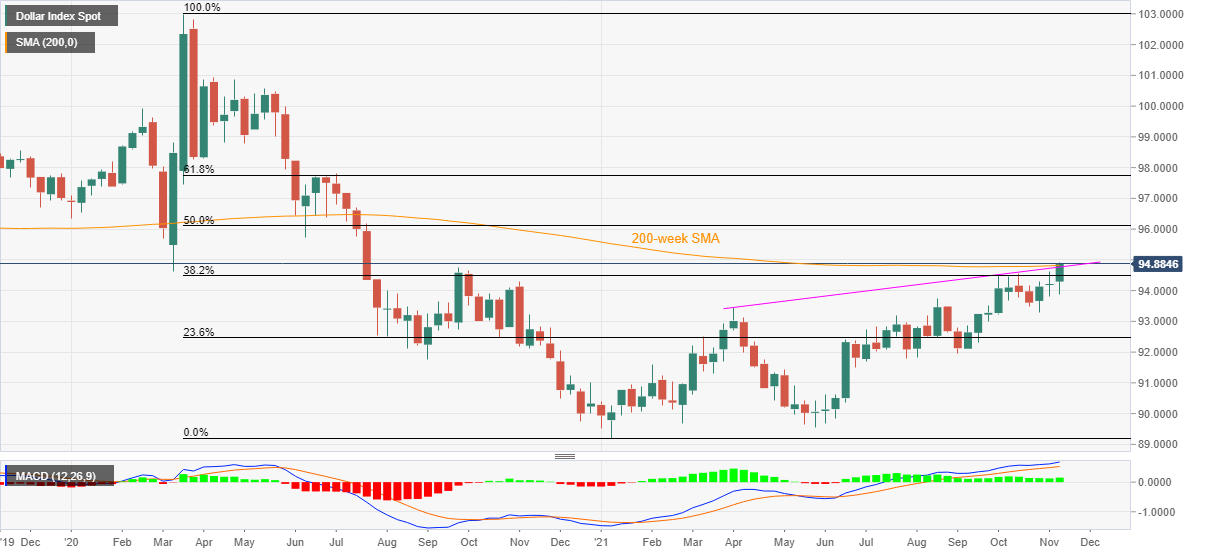
- Sustained break of 200-week SMA, seven-month-old resistance line direct bulls to June 2020 trough.
- 38.2% Fibonacci retracement offers immediate support before August month’s peak.
US Dollar Index (DXY) pares recent gains below the 95.00 threshold during an inactive Asian session on Thursday. The greenback gauge jumped to the highest levels since July 2020 the previous day while also crossing an ascending resistance line from April and 200-week SMA.
In addition to clearing the key upside hurdles, namely the stated SMA and trend line, bullish MACD signals also keep the DXY buyers hopeful.
Hence, the upside momentum is likely on the way to the June 2020 low near 95.70 before challenging the 50% Fibonacci retracement (Fibo.) of March 2020 to January 2021 downside, near 96.10.
However, 61.8% Fibo. level surrounding 97.75 offers a tough nut to crack for the US Dollar bulls afterward.
Alternatively, a daily closing below the resistance-turned-support line near 94.75 will aim for the 38.2% Fibonacci retracement, around 94.50.
In a case where the DXY remains weak past 94.50, August month’s high and October’s low, respectively around 93.70 and 93.25, will be in focus.
DXY: Weekly chart
Trend: Further upside expected