WTI Price Analysis: Teasing a symmetrical triangle breakdown, focus on Friday’s close
- WTI extends a three-day downtrend, remains offered below $80.
- The US oil is eyeing a symmetrical triangle breakdown on the 1D chart.
- Bearish RSI backs the downside bias, targets 50-DMA at $77.28.
WTI (NYMEX futures) is licking its wounds near $79.50, having hit weekly lows at $79.14 on Thursday.
In doing so, the US oil extends the losing streak into the third straight session, continuing with its corrective decline from seven-year peaks of $84.98 reached on October 25.
From a short-term technical perspective, WTI’s latest leg down is seen threatening the rising trendline support on the daily chart at $79.11.
A daily closing below the latter could confirm a downside breakout from a two-month-long symmetrical triangle formation, opening floors a bearish run towards the ascending 200-Daily Moving Average (DMA) at $68.82.
Ahead of that target, the 50-DMA at $77.28 will offer an immediate cushion to WTI buyers.
If that fails to hold up, then sellers will take over complete control, attacking the next support at $73.62, which is the mildly bullish 100-DMA.
The downside appears more favored, as the 14-day Relative Strength Index (RSI) inches lower below the midline.
WTI: Daily chart
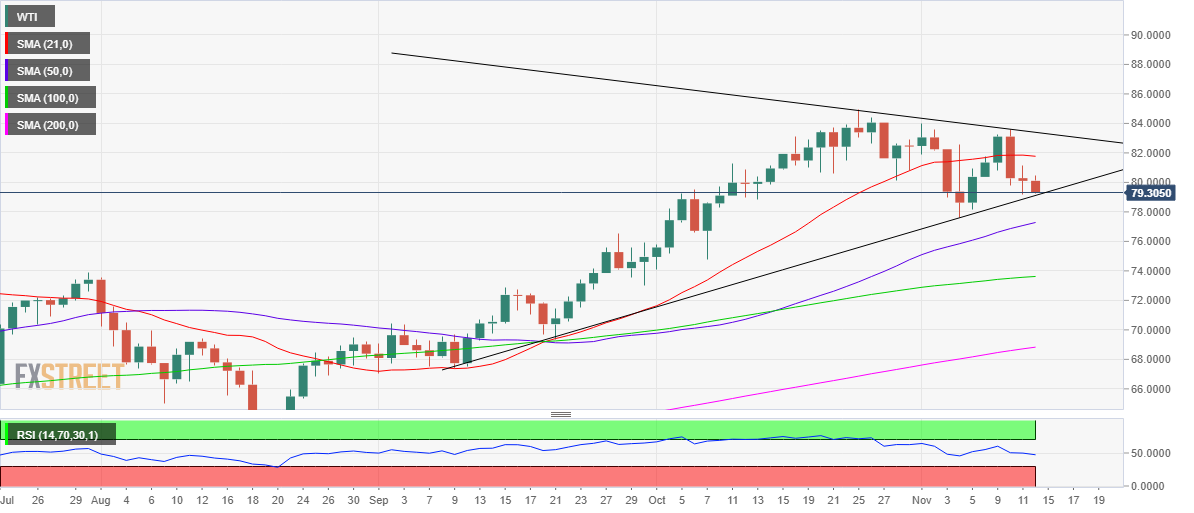
Alternatively, any recovery attempts could meet the initial supply at the $80 round figure, above which the horizontal 21-DMA at $81.77 would be tested.
The falling trendline resistance at $83.39 could be the last line of defense for WTI bears. A firm break above the latter could yield a triangle breakout, which could call for a revival of the recent uptrend.
WTI: Additional levels to watch