Gold Price Forecast: $1,800 likely to cap XAU/USD’s road to recovery – Confluence Detector
- Gold price rebounds but not out of the woods yet while below $1,800.
- Range play is likely to continue in gold amid Thanksgiving Holiday.
- Gold could stage a deep correction if $1,850 becomes resistance.
Gold is in the green zone for the first time this week, attempting to recover a part of Wednesday’s sell-off to three-week lows of $1,779. Thanksgiving Holiday in the US offers little motivation to the dollar bulls, as they consolidate the hawkish Fedspeak and minutes-led upside. The sluggish price action in the yields and the greenback is aiding the rebound in gold price. Although the further upside appears elusive, as the $1,800 mark is likely to be a tough nut to crack for gold bulls.
Read: Gold Price Forecast: Thanksgiving Day unlikely to offer respite to XAU/USD bulls amid a bear flag
Gold Price: Key levels to watch
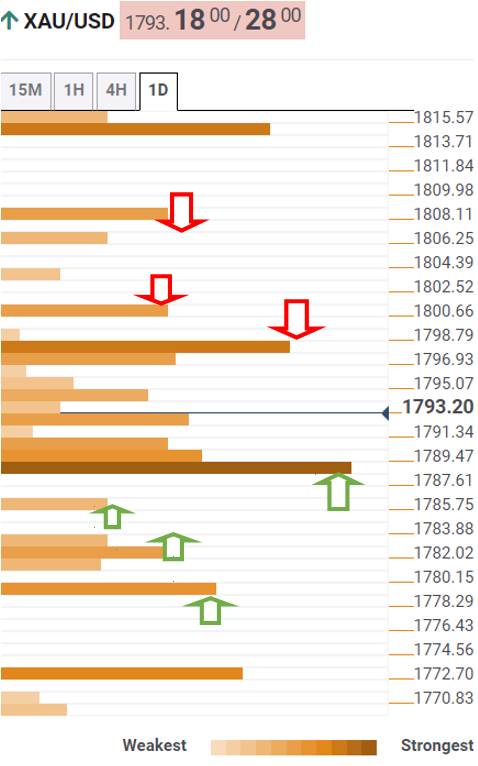
The Technical Confluences Detector shows that the gold price is defending critical support around $1,790, which is the intersection of the SMA50 one-day, Fibonacci 38.2% one-month and Fibonacci 61.8% one-day.
If the sellers find a strong foothold below the latter, then the recent downtrend could resume towards the Fibonacci 38.2% one-day at $1,785.
Further south, the confluence of the Fibonacci 23.6% one-day and Bollinger Band one-hour Lower at $1,782 will guard the downside.
The next stop for gold sellers is envisioned at $1,779, the meeting point of the previous day’s low and the pivot point one-day S1.
On the flip side, gold bulls need acceptance above the powerful $1,797 hurdle, which is the convergence of the Fibonacci 23.6% one-month, pivot point one-day R1 and the previous day’s high.
The next relevant upside target is seen at $1,800, the pivot point one-week S3.
The additional advances will then challenge the bearish commitments near $1,807, where the SMA200 four-hour, Fibonacci 161.8% one-day and pivot point one-day R2 merge.
Here is how it looks on the tool
About Technical Confluences Detector
The TCD (Technical Confluences Detector) is a tool to locate and point out those price levels where there is a congestion of indicators, moving averages, Fibonacci levels, Pivot Points, etc. If you are a short-term trader, you will find entry points for counter-trend strategies and hunt a few points at a time. If you are a medium-to-long-term trader, this tool will allow you to know in advance the price levels where a medium-to-long-term trend may stop and rest, where to unwind positions, or where to increase your position size.