GBP/USD Price Analysis: Tuesday’s Doji need validation from 1.3360
- GBP/USD struggles to extend corrective pullback from yearly low.
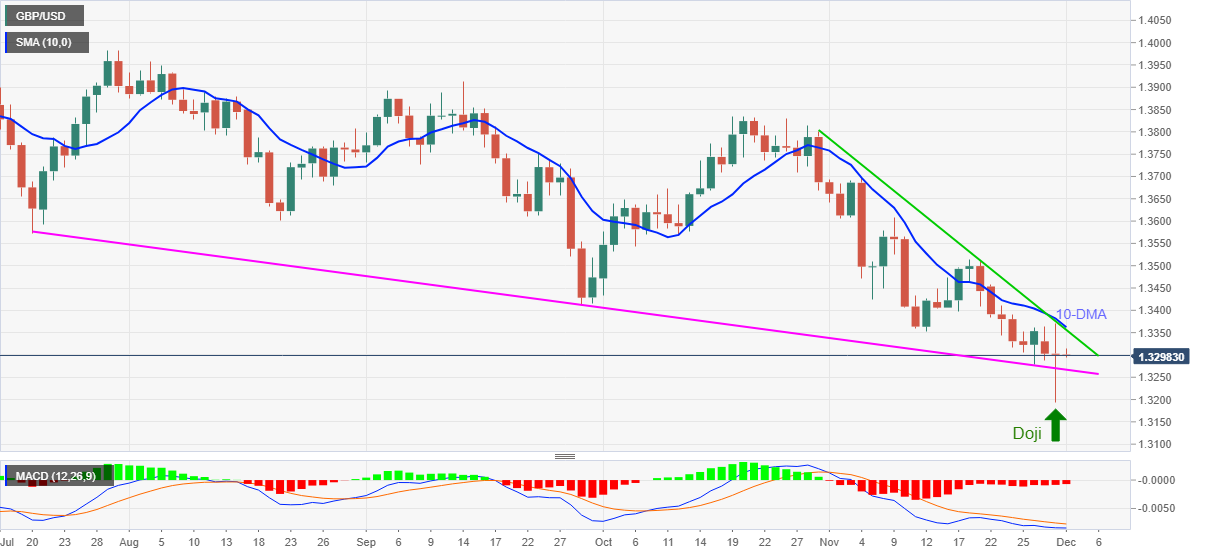
- 10-DMA, monthly resistance line challenge bullish candlestick formation.
- Bearish MACD signals keep sellers hopeful around four-month-old support line.
GBP/USD remains sidelined around 1.3300 during Wednesday’s Asian session, after refreshing the 2021 bottom the previous day.
The corrective pullback seems to take clues from Tuesday’s bullish Doji candlestick at the multi-day low. However, bearish MACD signals and convergence of the 10-DMA and one-month-old descending trend line, around 1.3360, challenge the bulls.
Should the quote rises past 1.3360, September’s low around 1.3410 and November 18 swing high close to 1.3515 will be in focus.
Alternatively, a downward sloping trend line from July, near 1.3265, will pause the GBP/USD bears before directing them to the yearly bottom of 1.3194.
During the quote’s weakness past 1.3194, October 2020 top around 1.3175 will precede the latest 2020 trough close to 1.3130 to challenge the pair sellers.
To sum up, GBP/USD remains inside the broad bearish trend despite the latest bullish candlestick formation.
GBP/USD: Daily chart
Trend: Further weakness expected