WTI Price Analysis: 200-DMA defends bulls above $70.00
- WTI remains pressured after declining the most in over a week.
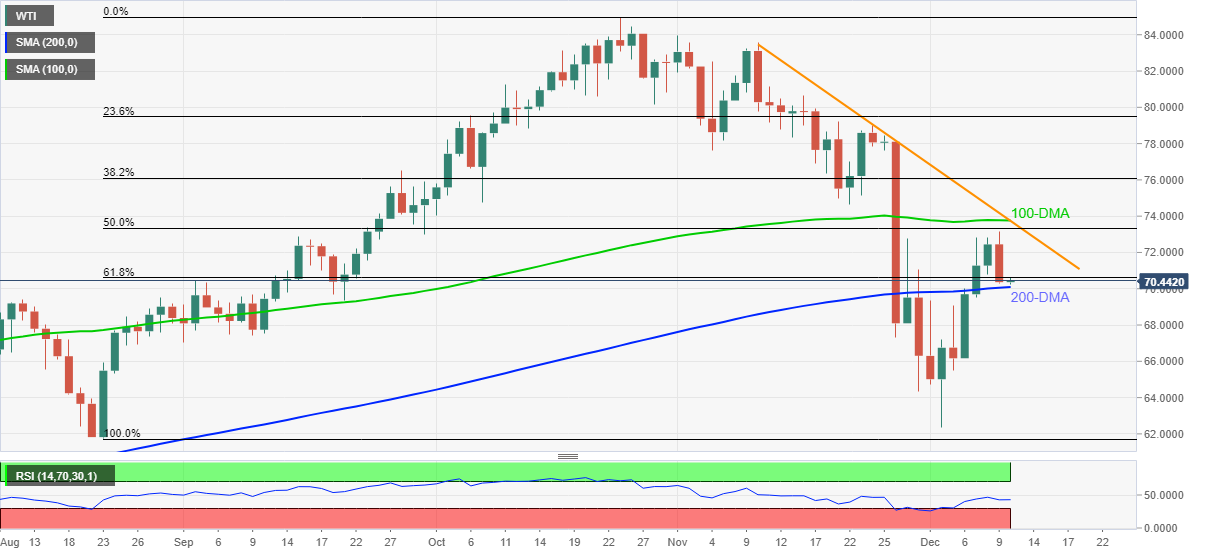
- Steady RSI, downside break of 61.8% Fibonacci retracement keeps sellers hopeful.
- $73.75-80 becomes a tough nut to crack for oil buyers.
WTI crude oil prices grind lower around $70.40-50, up 0.10% intraday during early Friday.
The black gold posted the biggest daily losses in eight days the previous day, breaking 61.8% Fibonacci retracement (Fibo.) of August-October upside. However, the 200-DMA challenges the commodity sellers of late.
Given the steady RSI and the quote’s hesitance in breaking the 200-DMA, prices are likely to recover should they bounce back beyond the stated Fibonacci retracement level of $70.60.
Following that, 50% Fibo. level of $73.35 may lure WTI bulls but a confluence of 100-DMA and descending trend line from November 10, near $73.75-80, will be a strong resistance to watch.
Alternatively, a daily closing below 200-DMA level of $70.00 will trigger a slump targeting an area comprising multiple supports around $67.50-30.
During the WTI oil bear’s dominance past $67.30, the recent low of $62.35 and August month’s bottom surrounding $61.75 will be in focus.
WTI: Daily chart
Trend: Recovery expected