USD/CHF Price Analysis: Firmer inside weekly triangle above 0.9200
- USD/CHF extends the week-start rebound while poking intraday high.
- Steady RSI, symmetrical triangle favor sideways moves, 100-SMA adds strength to the 0.9250 hurdle.
- Six-week-old ascending trend line challenges bears, monthly low adds to the downside filters.
USD/CHF remains mildly bid around 0.9230, holding Monday’s recovery moves during early Tuesday inside a one-week-old symmetrical triangle formation.
In addition to the chart pattern suggesting the sideways grinds of the major currency pair, a risk barometer, steady RSI line also portrays the pair trader’s cautious mood.
That said, the 100-SMA offers additional strength to the triangle’s resistance line near 0.9250, a break of which will propel the quote towards late November’s swing high near 0.9275.
Should USD/CHF bulls keep reins past 0.9275, the 0.9300 round figure and the 0.9325 level may act as buffers before directing the prices towards the last month’s peak of 0.9373.
Alternatively, a downside break of the stated triangle’s support, around 0.9205 at the latest, will direct the USD/CHF pair towards refreshing the monthly low, currently near 0.9165.
However, an upward sloping trend line from November 01, close to 0.9150, can challenge the pair bears afterward.
USD/CHF: Four-hour chart
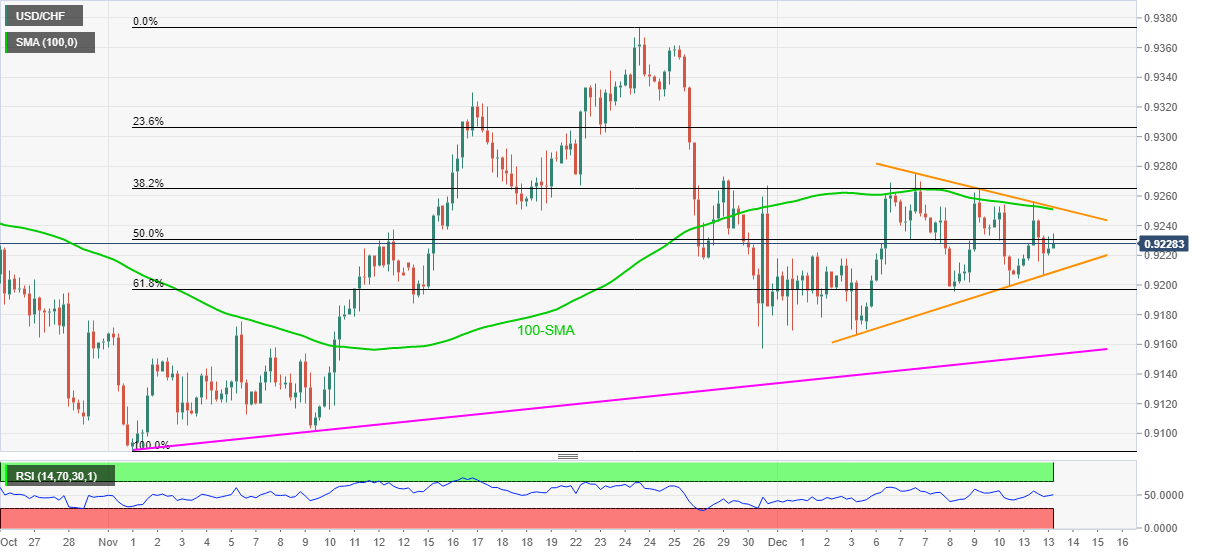
Trend: Sideways