WTI Price Analysis: Recovery remains elusive below $70.30-50 resistance area
- WTI portrays corrective pullback after heavy fall in the last two days.
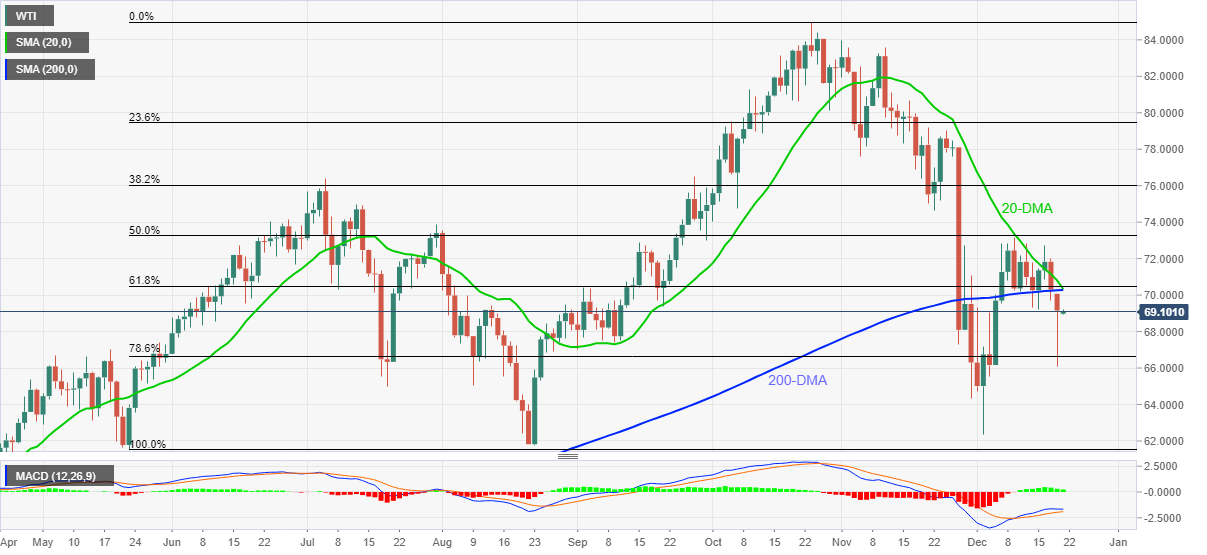
- 20-DMA, 200-DMA and 61.8% Fibonacci retracement challenge the bulls.
- Mid-2021 lows lure sellers amid receding bullish bias of MACD.
WTI consolidates recent losses around $69.20, up 0.30% intraday, during Tuesday’s Asian session.
The black gold refreshed a two-week low during the latest downturn before bouncing off $66.10. The corrective pullback, however, fails to gain support from MACD.
Also challenging the recovery moves is a convergence of the 200-DMA, 20-DMA and 61.8% Fibonacci retracement (Fibo.) of May-October upside, around $70.30-50.
Even if the commodity prices cross the $70.50 hurdle, November’s low and July’s high, respectively around $74.65 and $76.40, will challenge WTI bulls.
Alternatively, the fresh downside will aim for 78.6% Fibo. level near $66.70 before $65.00 and the monthly low of $62.34 question the bears.
Adding to the downside filters is the May month’s low of $61.52 and the $60.00 round figure.
WTI: Daily chart
Trend: Further weakness expected