Silver Price Analysis: 50-SMA probes XAG/USD’s declines towards $21.80
- Silver remains pressured around intraday low, battles short-term key SMA support.
- Descending RSI line, not oversold, directs sellers towards one-week-old horizontal area.
- $23.40 appears a tough nut to crack for the bulls, yearly low on bear’s radar.
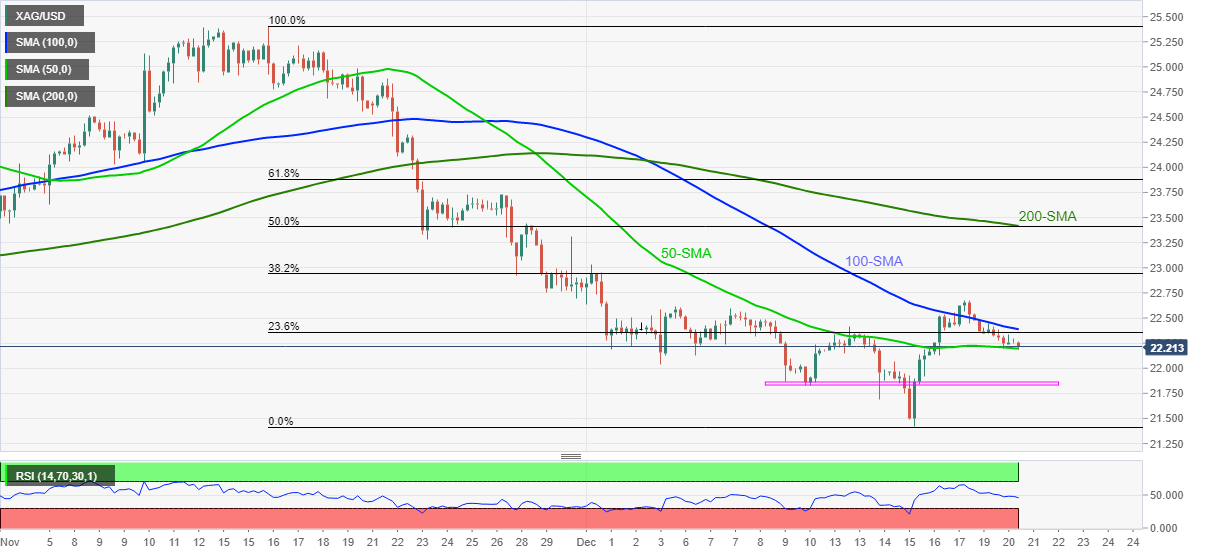
Silver (XAG/USD) stays depressed around an intraday low of $22.18, down 0.18% on a day during the three-day downtrend amid early Tuesday.
In doing so, the bright metal sellers attack 50-SMA support as failures to cross the 100-SMA and downward sloping RSI line, not near oversold territory, suggests the quote’s further weakness.
That said, the $22.00 threshold may offer an intermediate halt during the metal’s fall targeting the weekly horizontal support area near $21.80. However, double bottoms marked during December and September, near $21.40, will be a crucial support to watch afterward.
In a case where the XAG/USD prices decline below $21.40, the $20.00 psychological magnet should gain the market’s attention.
Meanwhile, recovery moves may initially aim for the 100-SMA level of $22.40 before Friday’s peak of $22.67.
Following that, 38.2% Fibonacci retracement (Fibo.) of November 16 to December 15 downside, around $23.00, will test the silver buyers before directing them to the convergence of the 200-SMA and 50% Fibo. close to $23.40.
Silver: Four-hour chart
Trend: Further weakness expected