GBP/USD Price Analysis: Closing in on make-or-break points near 1.3500
- GBP/USD grinds higher around multi-day top, up for the third consecutive day.
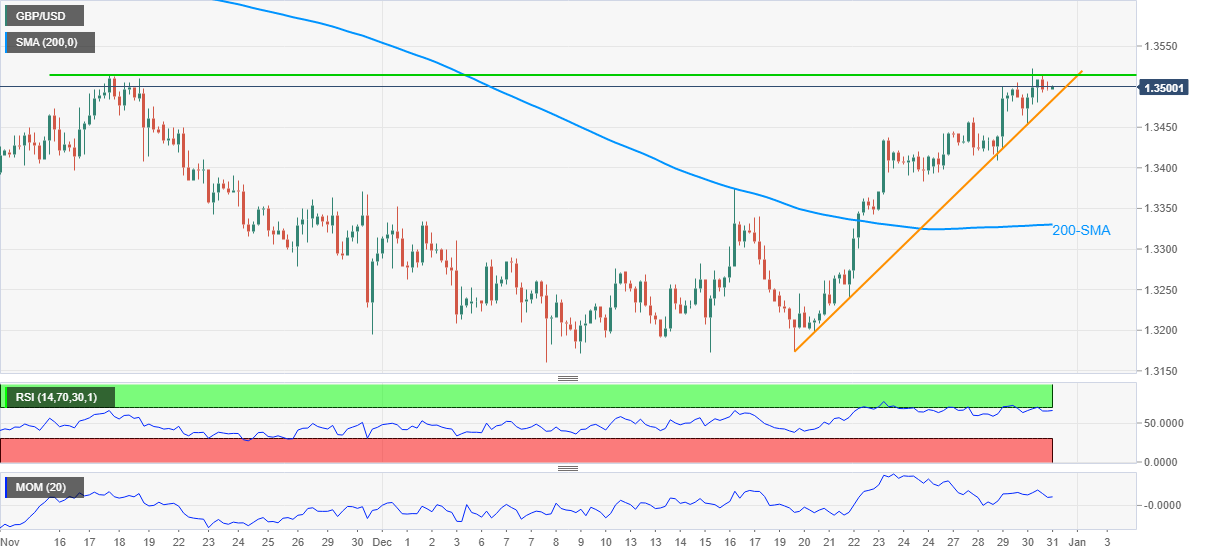
- Two-week-old ascending support line, horizontal line from November 18 limit immediate moves, RSI conditions hint at buyer’s exhaustion.
Alike other major currency pairs, GBP/USD also treads water around 1.3500 heading into Friday’s European session. In doing so, the cable pair seesaws near the highest levels in seven weeks amid a lack of major data/events.
That said, the pair’s immediate moves are confined between an upward sloping trend line from December 20 and a horizontal line comprising double tops marked since November, namely between 1.3480 and 1.3515.
It should be noted, however, that the RSI conditions repeatedly test overbought region while the Momentum line is also descending, which in turn hints at the receding bullish bias for the pair.
However, a clear downside break of 1.3480 becomes necessary for the GBP/USD sellers before they can aim for the 200-SMA support of 1.3330.
It’s worth observing that the pair’s declines past 1.3330 will be challenged by the 1.3170-60 area comprising the monthly, also the yearly, low.
On the contrary, an upside clearance of 1.3515 will aim for the mid-October swing low near 1.3570 before November 09 top of 1.3607 lures the GBP/USD buyers.
In a case where the cable remains directed towards the north past 1.3607, the last month’s high near 1.3700 will be in focus.
GBP/USD: Four-hour chart
Trend: Pullback expected