USD/TRY Price Analysis: Seesaws around 20-DMA, $14.00 appears key hurdle
- USD/TRY holds onto the weekly grind around key technical indicators.
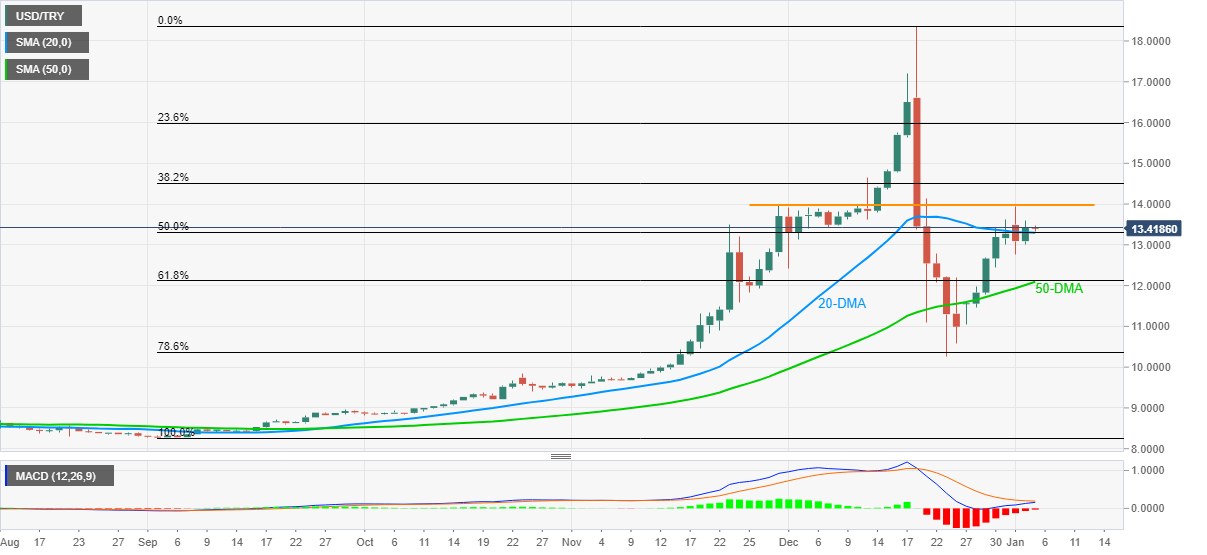
- 20-DMA, 50% Fibonacci retracement clutch the immediate moves.
- Sustained trading above 50-DMA, MACD conditions signal further upside.
- Five-week-old horizontal line challenges short-term buyers, 61.8% Fibo. adds to the downside filters.
USD/TRY remains sidelined around $13.40 during Wednesday’s Asian session.
In doing so, the Turkish lira (TRY) pair takes rounds to the 20-DMA and 50% Fibonacci retracement (Fibo.) of September-December upside of late.
It’s worth noting, however, that the quote’s sustained trading above 50-DMA, as well as ability to bounce off 78.6% Fibo., favor buyers to aim for the horizontal resistance established since November 30, around $14.00.
Following that, $14.80 and $15.70 may test the bulls before directing them to the record high marked in the last month around $18.35.
Alternatively, pullback moves remain elusive beyond convergence of the 50-DMA and 61.8% Fibonacci retracement level near $12.10.
Also acting as short-term support is the $12.00 threshold, a break of which will again direct the quote towards 78.6% Fibo. level surrounding $10.40.
Overall, USD/TRY bulls are in command but seem cautious ahead of the key US data docket.
USD/TRY: Daily chart
Trend: Further upside expected