US Dollar Index Price Analysis: DXY keeps bounce off 10-DMA
- DXY holds onto recent gains post-FOMC Minutes, refreshes intraday high.
- Six-week-old resistance line lures buyers, 50-DMA also restrict nearby downside.
- Sustained bounce off monthly horizontal support, steady RSI favor bulls.
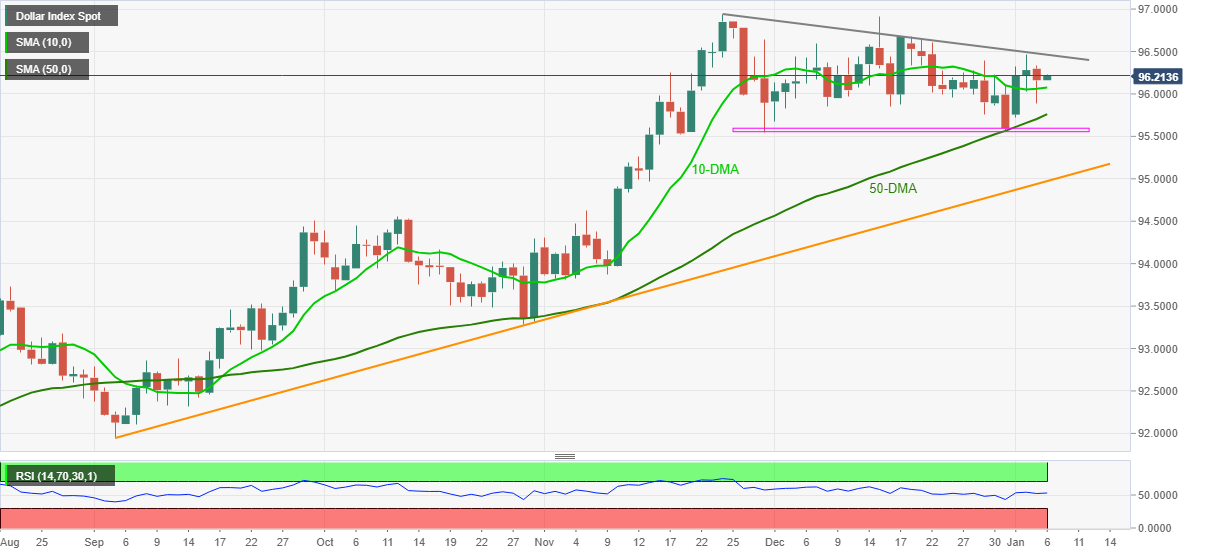
US Dollar Index (DXY) extends the Fed Minutes-led gains around 96.20 during early Thursday.
The greenback gauge dropped briefly below the 10-DMA before the FOMC Minutes triggered a rebound from 95.88 level. The recovery moves also take clues from the steady RSI and the quote’s ability to defend the monthly horizontal support.
That said, the US Dollar Index bulls currency aim for a descending resistance line from November 24, around 96.45.
However, any further upside will be challenged by 96.65 and the 97.00 threshold, not to forget multiple tops marked in November and December around 96.90-95.
Alternatively, 10-DMA and 50-DMA challenge the short-term downside of the DXY, around 96.05 and 95.75 respectively, ahead of the stated monthly horizontal support area near 95.60-55.
Following that, an ascending trend line from September, close to 94.97, will be crucial to watch.
To sum up, DXY bulls keep reins but have a bumpy road ahead.
DXY: Daily chart
Trend: Further upside expected