WTI Price Analysis: Sellers attack $78.00 to confirm rising wedge
- WTI extends Friday’s pullback from a two-month high, battles support line of a short-term bearish chart pattern.
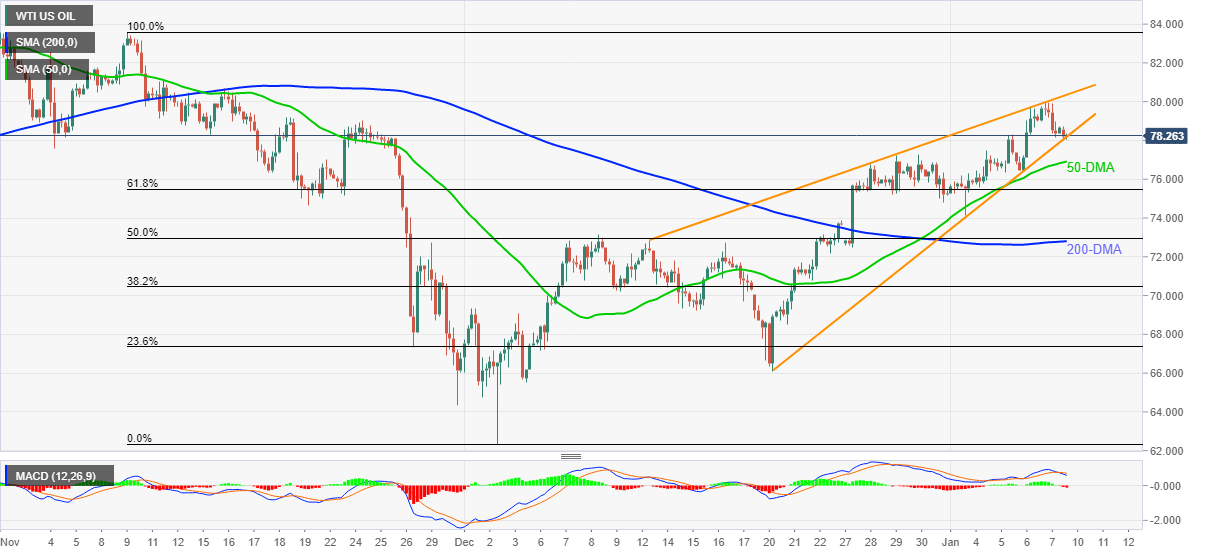
- 50-SMA adds to the downside filters, bearish MACD and failures to cross $80.00 keep sellers hopeful.
WTI remains pressured towards $78.00, down 0.80% intraday during Monday’s Asian session.
The black gold reversed from the highest levels since mid-November on Friday while portraying the buyers’ exhaustion inside a monthly rising wedge bearish pattern.
That said, the commodity’s inability to cross the $80.00 threshold and downbeat MACD signals hint at the further downside of the quote.
However, a clear break of $78.00 won’t be necessary for the WTI bears as the 50-SMA level surrounding $76.90 tests the sellers.
On breaking the $76.90 support, WTI crude oil confirms a bearish chart pattern with theoretical target near late December’s low close to $66.00. Though, a convergence of the 200-SMA and 50% Fibonacci retracement (Fibo.) of November – December downside, around $72.80-90, will offer an intermediate halt during the fall.
Alternatively, an upside clearance of the $80.00 will be a trigger for the oil prices rally towards the $84.00, near to November’s top. Following that, the year 2021 peak near $85.00 will be in focus.
WTI: Four-hour chart
Trend: Further weakness expected