Gold Price Forecast: XAU/USD key levels to watch amid cautious markets – Confluence Detector
- Gold’s fate hinges on the US bond market action, Ukraine updates.
- The US dollar draws renewed safe-haven demand amid firmer Treasury yields.
- Gold price turns bearish with technicals amid bond rout, 50-DMA back in sight.
Gold price continues to remain at the mercy of the dynamics in the US bond market and the developments surrounding the Russia-Ukraine crisis. Gold price has enjoyed good two-way businesses so far this Monday, although the renewed upside lacks follow-through momentum. Risk sentiment has turned sour as the EU readies more sanctions against Russia, which will buoy the safe-haven US dollar’s demand at gold’s expense. Further, the hawkish Fed’s outlook-led rally in the US Treasury yields is also likely to keep gold sellers cheerful, in the absence of top-tier economic events.
Read: Will commodities continue to outperform In Q2 2022? [Video]
Gold Price: Key levels to watch
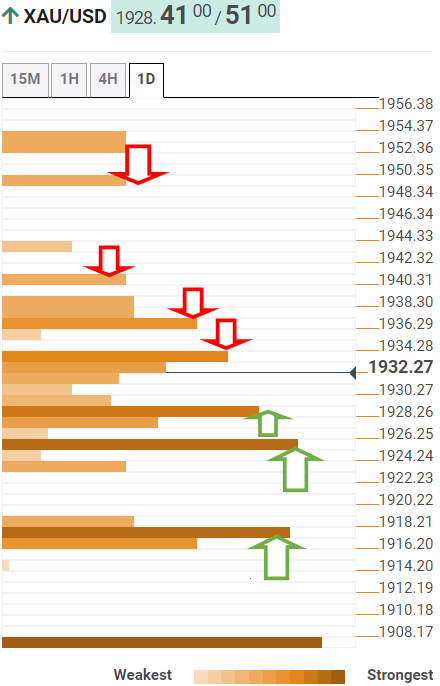
The Technical Confluences Detector shows that gold price is testing offers at powerful resistance of the Fibonacci 61.8% one-week at $1,934.
If the latter is scaled, then gold bulls will face the next relevant resistance around $1,937, which is the confluence of the pivot point one-day R1, SMA 50, 100 and 200 four-hour.
The previous day’s high at $1,940 will test the bearish commitment further up. A sustained break above that level will fuel a fresh rally towards the pivot point one-day R2 at $1,949.
On the flip side, gold sellers are attacking strong support at $1,928, which is the SMA5 one-day.
The next downside target aligns at $1,925, the confluence of the SMA5 four-hour and the Fibonacci 23.6% one-day.
Fierce cap at around $1,917 will be the last resort for gold bulls, as the latter is the intersection of the Fibonacci 38.2% one-week, the previous day’s low and the pivot point one-day S1.
Here is how it looks on the tool
About Technical Confluences Detector
The TCD (Technical Confluences Detector) is a tool to locate and point out those price levels where there is a congestion of indicators, moving averages, Fibonacci levels, Pivot Points, etc. If you are a short-term trader, you will find entry points for counter-trend strategies and hunt a few points at a time. If you are a medium-to-long-term trader, this tool will allow you to know in advance the price levels where a medium-to-long-term trend may stop and rest, where to unwind positions, or where to increase your position size.