USD/CHF Price Analysis: Struggle around 0.9600 despite a solid US dollar
- A firm US dollar and a dismal market mood weighed on the Swiss franc, losing some 0.15%.
- The US Dollar Index continues reaching YTD highs, now around 101.782.
- USD/CHF Price Forecast: Remains tilted upwards, but solid resistance around 0.9600 could spook buyers.
The USD/CHF rallies amidst a risk-off market sentiment, triggering a flight to safe-haven assets. In the FX space, the greenback is bolstered by increasing odds of an aggressive Federal Reserve, which propels the USD/CHF up some 0.17% in the North American session, and is trading at 0.9585 at the time of writing.
As previously mentioned, the buck remains in the driver’s seat in the FX complex. The US Dollar Index, a measurement of the greenback’s value against a basket of six peers (including the Swiss franc), is trading at multi-year highs around 101.782 and is gaining 0.66%, despite falling US Treasury yields.
The US 10-year Treasury yield is losing in the day twelve basis points, at 2.779%, after hitting a YTD high at 2.981% last Wednesday.
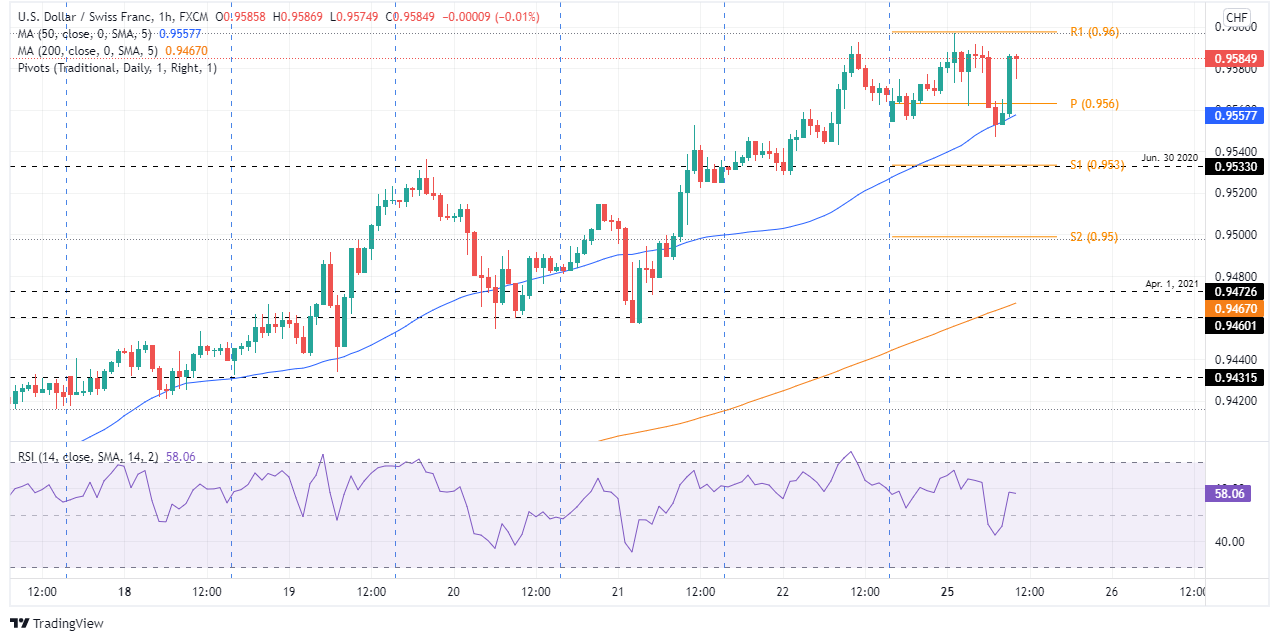
On Monday’s Asian and European session, the USD/CHF opened below last week’s close, though it achieved a bounce near the 0.9600 figure, retreating afterward, before settling around the daily pivot point at 0.9560.
USD/CHF Price Forecast: Technical outlook
The USD/CHF remains bullish from a daily chart perspective, but the Relative Strength Index (RSI) reading around 74.50 suggests the pair could be topping in the near term.
The USD/CHF 1-hour chart shows bull’s failure to reclaim 0.9600 opened the door for a dip towards the daily pivot point around 0.9560. However, they recovered some ground, lifting the USD/CHF price to 0.9580. The Relative Strength Index (RSI) is back above the 50-midline (bullish territory) at 58.12. However, price action in the overnight session for North American traders showed that the 0.9600 supply zone would be difficult to overcome.
Upwards, the USD/CHF first resistance would be the confluence of the figure and the R1 daily pivot at 0.9600. A breach of the latter would expose the R2 daily pivot at 0.9630, followed by the June 5, 2020 swing high around 0.9650.
On the flip side, the USD/CHF first support would be the confluence of the 50-simple moving average (SMA) and the daily pivot near the 0.9557-0.9560 range. Once cleared, the following support would be the S1 daily pivot, which confluences with June 30, 2020, daily high, turned support at 0.9533, followed by the S2 daily pivot at 0.9500.
Key Technical Levels