USD/JPY Price Analysis: Clings to 130.40s and is recording gains for five consecutive weeks
- The USD/JPY is about to register its modest weekly gains in the last five weeks, up 0.47%.
- High US Treasury yields led by the 10-year, reaching 3.10%, underpinned the major.
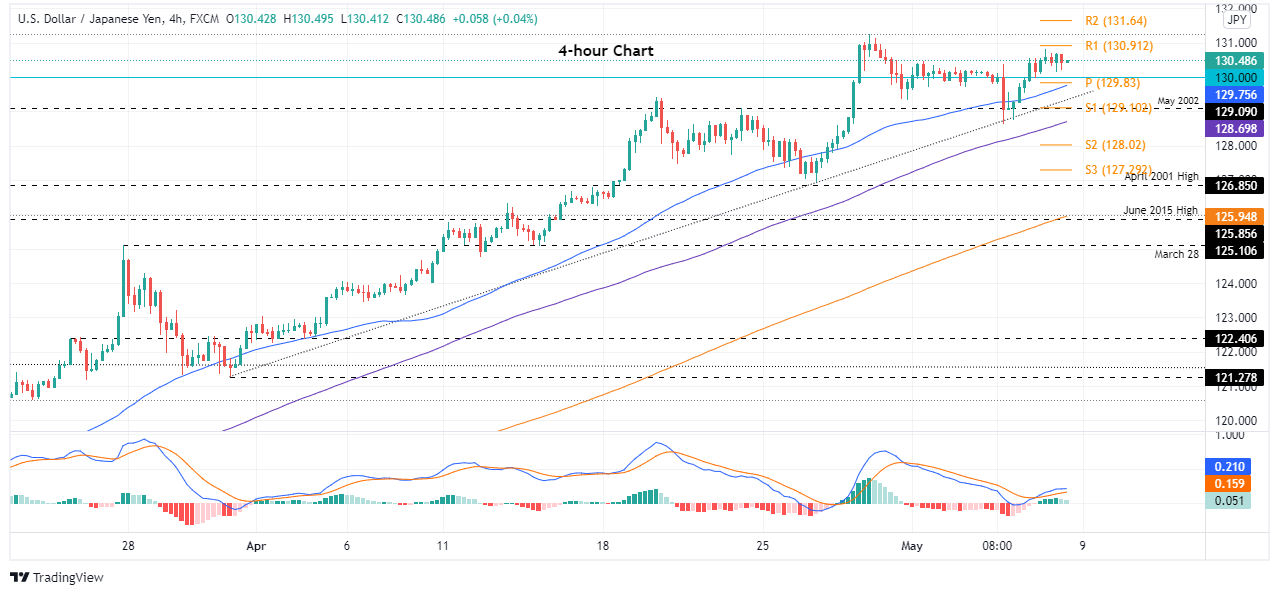
- USD/JPY Price Forecast: Upward biased in the daily chart, while the 4-hour shows consolidation around current levels.
The USD/JPY records decent gains during the North American session of 0.18% and is about to finish the week above the 130.00 mark amidst a dismal market mood for the second consecutive week. At 130.48, the USD/JPY is still upward pressured by the US 10-year Treasury yield, rising almost six basis points, sitting at 3.10%.
Sentiment remains downbeat post-Wednesday’s Federal Reserve rate hike of 50-bps. Albeit higher US Treasury yields on Friday, the greenback edges down, as portrayed by the US Dollar Index, which registers losses of 0.13% and was last seen at 103.428.
On Friday, the USD/JPY opened above the 130.00 mark and edged towards the daily high at around 130.81. However, late in the Asian session dipped towards the confluence of the 50 and the 100-hour simple moving averages (SMAs), but positive US macroeconomic data lifted the pair to current price levels.
USD/JPY Price Forecast: Price Forecast
The USD/JPY remains uptrend, though Friday’s price action failed to reach a fresh YTD high above 131.25. Despite USD/JPY bulls taking a breather, it is worth noting that as of today, the 100-day moving average (DMA) at 110.31 crossed over the 200-DMA at 109.97, further cementing the upward bias.
The 4-hour chart depicts the USD/JPY consolidating around current levels, and the R1 daily pivot at 130.91 proved to be solid resistance challenging to overcome. If the USD/JPY is to break upwards, the previous-mentioned 130.91 would be its first resistance. Break above would expose the 131.00 mark, followed by the YTD high at 131.25, followed by the R2 pivot point at 131.64.
On the flip side, the USD/JPY first support would be the 130.00 mark. A breach of the latter would expose the confluence of the 50-simple moving average (SMA) and the daily pivot around 129.75-83. Once cleared, the next support would be the 100-SMA at 128.69.
Key Technical Levels