US Dollar Index Price Analysis: DXY pullback remains elusive unless breaking 103.90
- DXY remains pressured after reversing from 20-year high.
- Three-week-old support line restricts immediate downside, monthly horizontal area tests bears.
- Bulls need clear break of 105.00 to aim for fresh multi-month high.
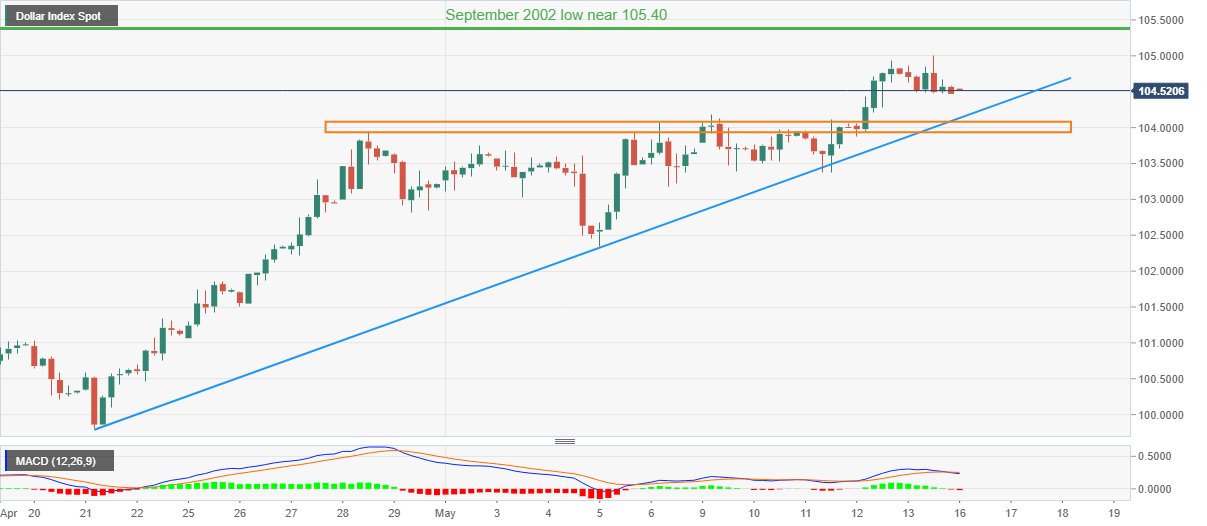
US Dollar Index (DXY) extends Friday’s pullback moves around 104.50 during a quiet Asian session on Monday.
In doing so, the greenback gauge justifies recently downbeat MACD signals to approach a three-week-old rising trend line support, near 104.10 by the press time.
However, multiple levels since April 28, around 103.90, restrict DXY’s weakness past 104.10.
Should the quote drop below 103.90, further downside towards the 103.00 threshold and then in direction to the monthly low of 102.34 can’t be ruled out.
Meanwhile, fresh recovery moves need to stay beyond the 105.00 round figure to aim for the September 2020 lows surrounding 105.6.
Following that, the late 2020 peak near 107.40 could lure DXY bulls.
Overall, US Dollar Index seems running out of steam to renew multi-year. The pullback moves, however, have limited downside to cheer.
DXY: Four-hour chart
Trend: Further weakness expected