NZD/USD Price Analysis: Bulls testing a critical resistance area
- NZD/JPY bulls are hard-pressed following poor growth data but could be on the verge of breaking the hourly resistance.
- New Zealand Q1 GDP -0.2 QoQ versus 0.6% expected, NZD/USD retreats towards 0.6250
- The bears will be lurking on any bull breakout.
NZD/JPY is testing the limits of the support and resistance channel on the hourly chart as follows:
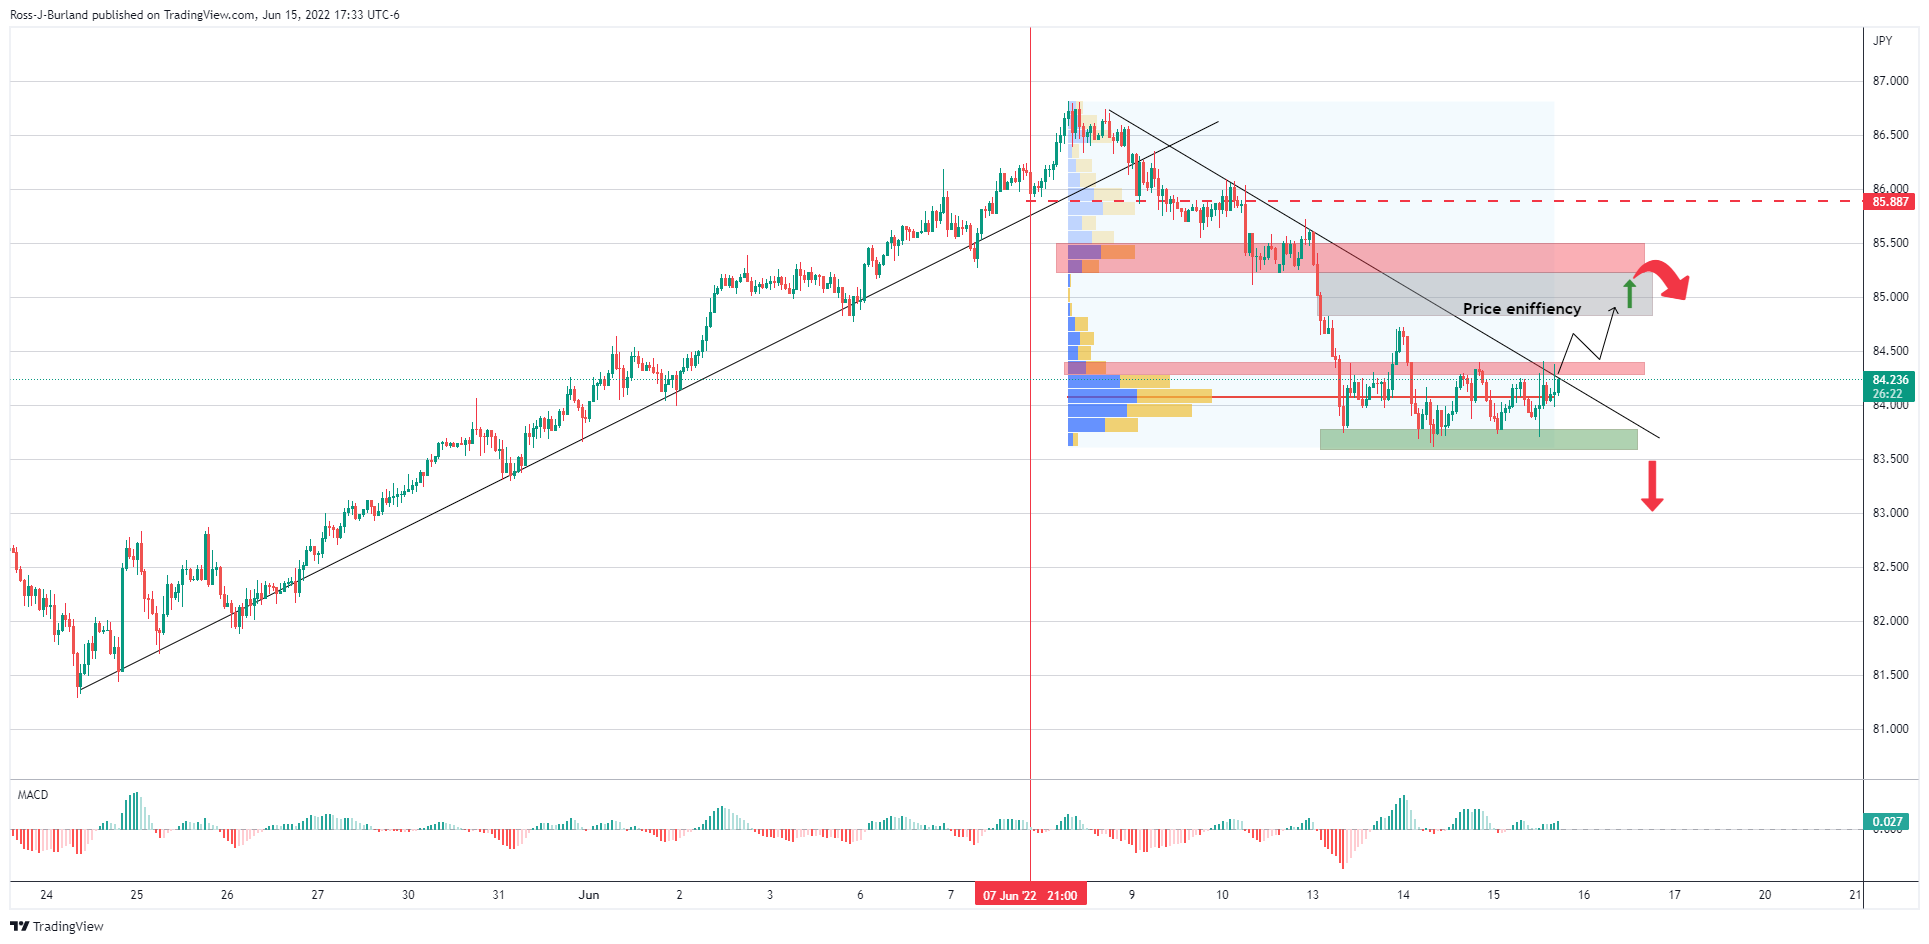
A break of the resistance opens the risk of a trendline breakout and a run towards the price inefficiency between 84.82 and 85.23. There would be expected to be a fair bit of resistance thereafter which could potentially lead to a downside correction and even a full-on continuation on the higher time frames such as the following daily chart's illustration:
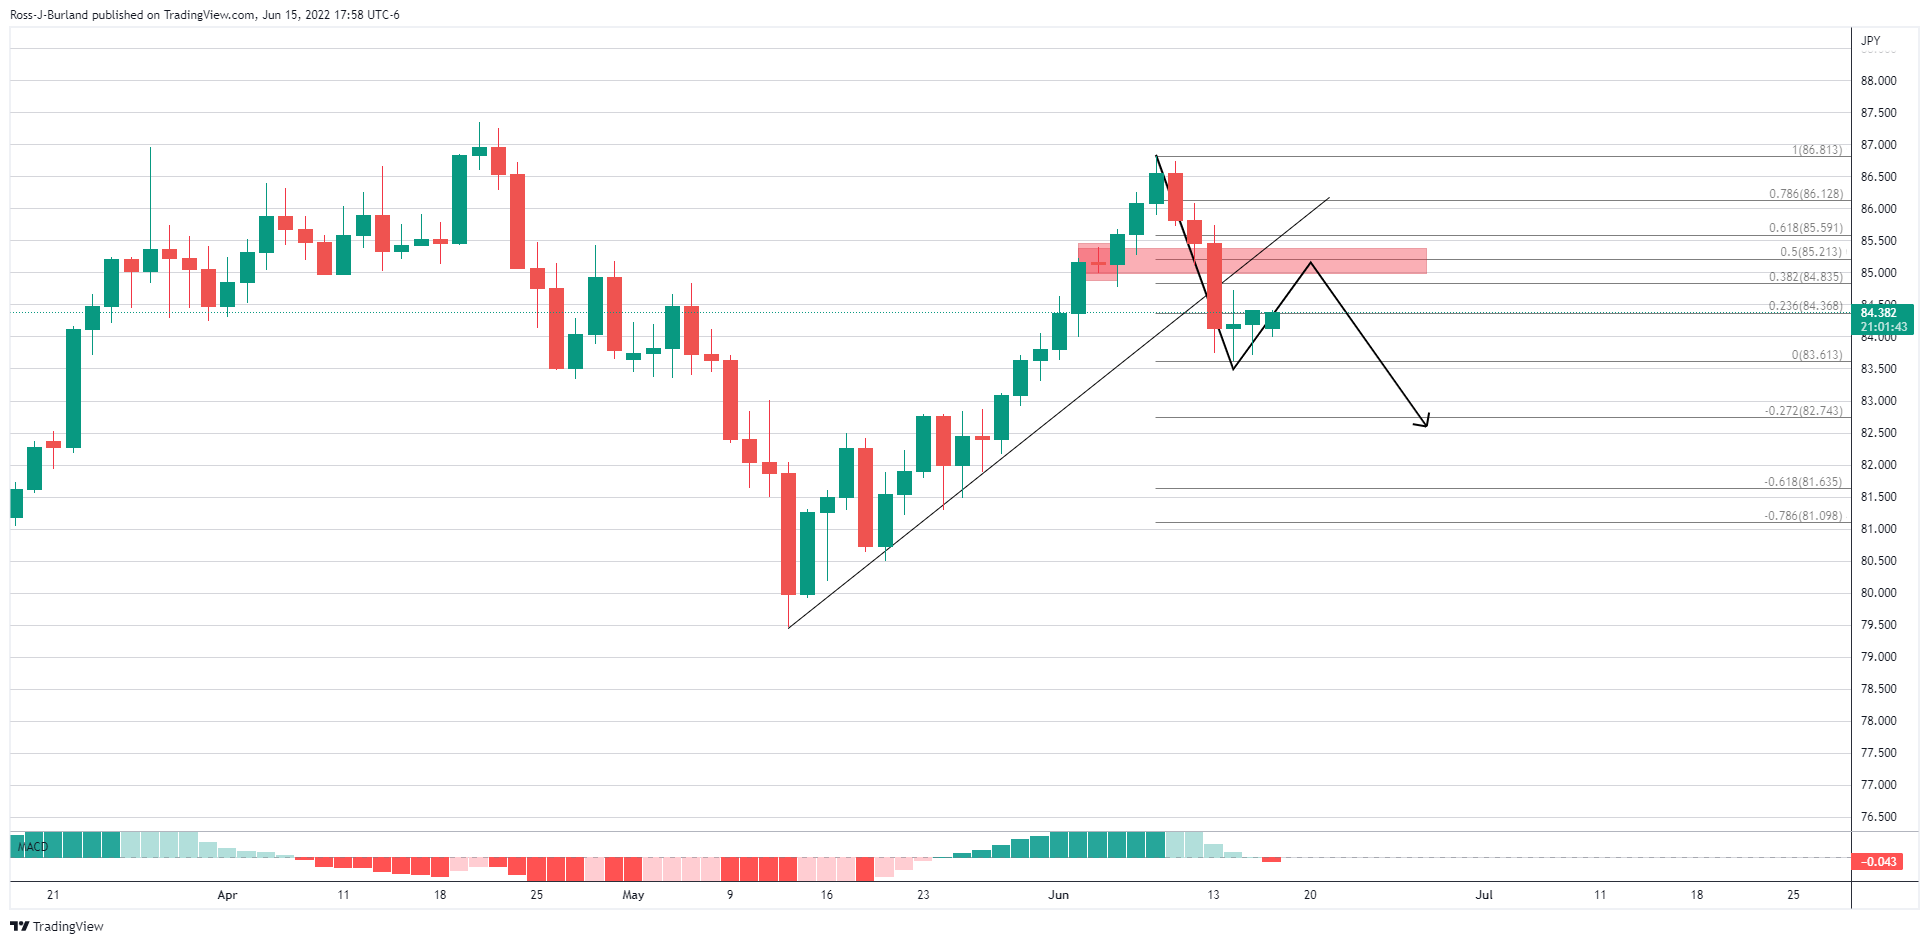
The price is accumulating and a retracement into the said target area meets the prior structure looking left, the break between the bull rally, and this would be expected to act as a resistance zone. This also has a confluence with the 38.2% Fibonacci retracements of the prior bearish impulse range that lead to a break of the trendline support.