USD/CAD Price Analysis: Further upside hinges on 1.2905 break
- USD/CAD fades bounce off 200-EMA, pares the biggest daily gains in a week.
- 50-EMA, seven-day-long horizontal area guards immediate upside.
- Three-week-old ascending trend line adds to the downside filters.
- Bullish MACD signals, sustained trading beyond key EMA favor buyers.
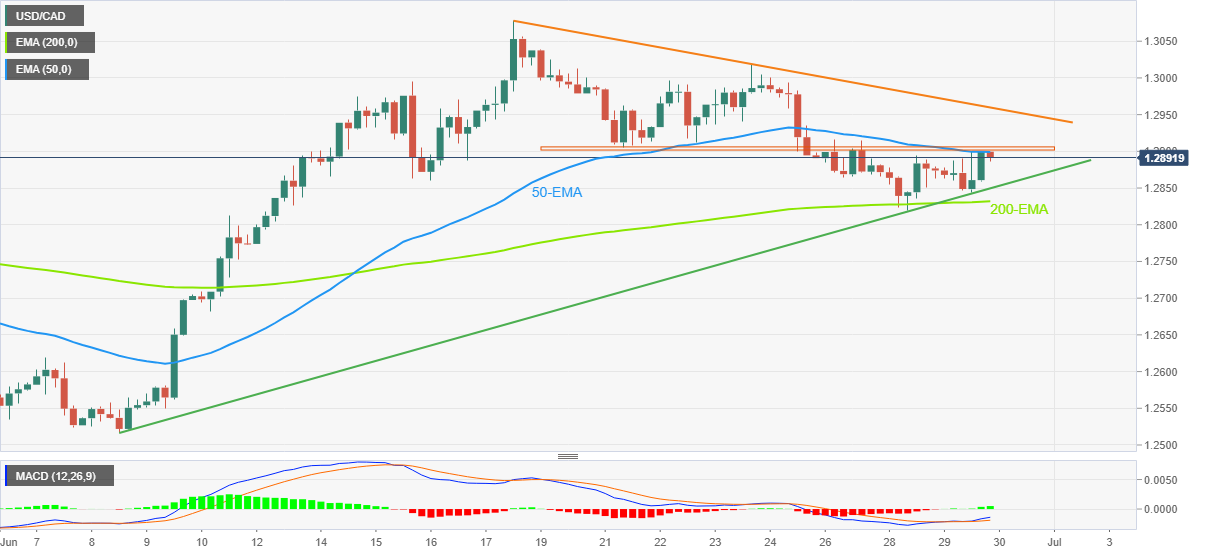
USD/CAD retreats from 1.2900 as buyers take a breather after the biggest daily jump in a week. In doing so, the Loonie pair eases from the 50-EMA and a short-term horizontal resistance during Thursday’s Asian session.
Given the quote’s sustained rebound from the 200-EMA, backed by the bullish MACD signals, USD/CAD prices are likely to extend the latest run-up.
However, a convergence of the 50-EMA and one-week-old horizontal area, surrounding 1.2900-05, becomes necessary for the buyers to keep reins.
Following that, a downward sloping resistance line from early June, around 1.2960, will act as an additional filter to the north before directing buyers towards the monthly top of 1.3078.
It should be noted that the 1.3000 psychological magnet and the previous weekly peak of 1.3017 could act as buffers during the rise.
On the contrary, a three-week-long rising trend line, at 1.2850 by the press time, restricts the USD/CAD pair’s immediate downside ahead of the 200-EMA level of 1.2832.
Should the pair drop below 1.2832, the latest swing low near 1.2820 and the 1.2800 threshold may test bears before giving them control.
USD/CAD: Four-hour chart
Trend: Further upside expected