USD/JPY Price Analysis: Retreats from 50-day EMA as sellers attack 133.00
- USD/JPY fades bounce off two-month low, holds lower ground near daily bottom.
- Bearish MACD signals another attempt to break 100-day EMA.
- Three-week-old descending trend line adds to the upside filters.
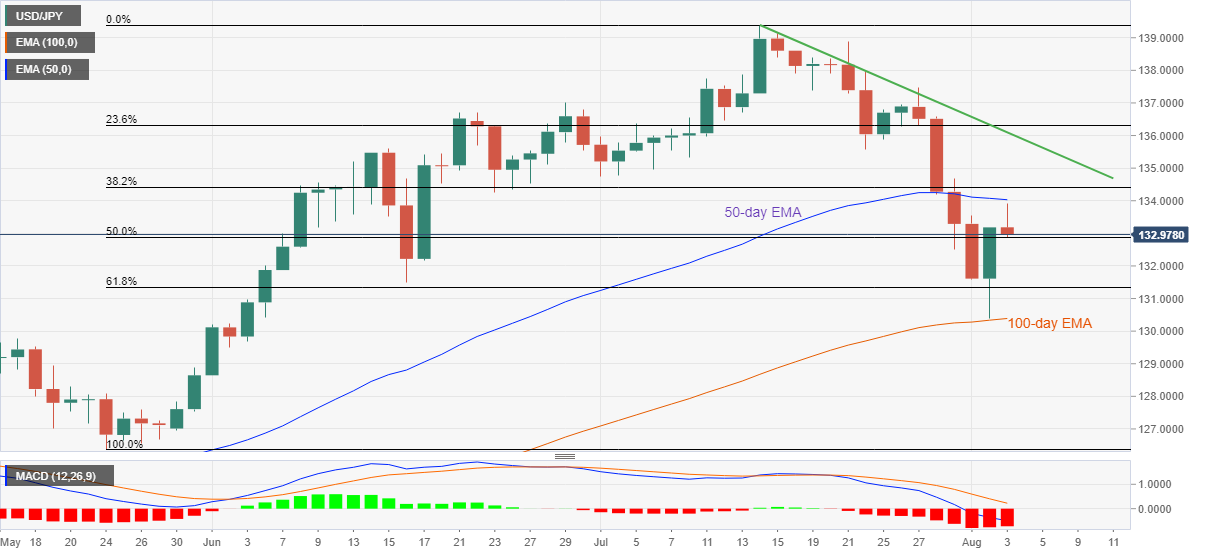
USD/JPY consolidates the biggest daily gains in six weeks around 133.00 during Wednesday’s Asian session. In doing so, the yen pair fades bounce off the 100-day EMA while reversing from the 50-day EMA.
Given the bearish MACD signals and the US dollar’s failures to remain firmer, the USD/JPY prices are likely to extend the latest pullback moves.
That said, the 61.8% Fibonacci retracement of May-July upside near 131.30 could lure the short-term sellers.
However, clear downside break of the 100-day EMA, around 130.40 by the press time, becomes necessary to convince USD/JPY bears. Even so, the 130.00 threshold could test the south-run.
Alternatively, recovery moves need a daily closing beyond the 50-day EMA level near 134.00 to challenge the 38.2% Fibonacci retracement resistance of 134.40.
Following that, a downward sloping resistance line from mid-July, close to 136.10, will be important as it holds the key to the USD/JPY rally towards refreshing the yearly high near 139.40. In doing so, the 140.00 psychological magnet will be on the bull’s radar.
USD/JPY: Daily chart
Trend: Further weakness expected