EUR/JPY Price Analysis: Buyers and sellers face off as a doji emerges around 136.20
- EUR/JPY oscillates around 136.20 after buyers struggle at 137.00.
- In the near term, the EUR/JPY is range-bound within 136.00-136.80.
The EUR/JPY finished almost flat on Thursday after hitting a daily low at 135.63, followed by a rally towards its weekly high at 136.92. Nevertheless, buyers lost steam and booked profits, while the EUR/JPY dived towards the 136.10 area. At the time of writing, the EUR/JPY is trading at 136.21 up 0.09% as the Asian session begins.
EUR/JPY Price Analysis: Technical outlook
The EUR/JPY daily chart illustrates the formation of a doji, as Thursday’s price action, even though was large, neither buyers/sellers capitalized on each other weaknesses. Therefore, due to the uptrend preceding the chart pattern, the EUR/JPY might dip towards 136.00 due to its neutral-to-downward bias.
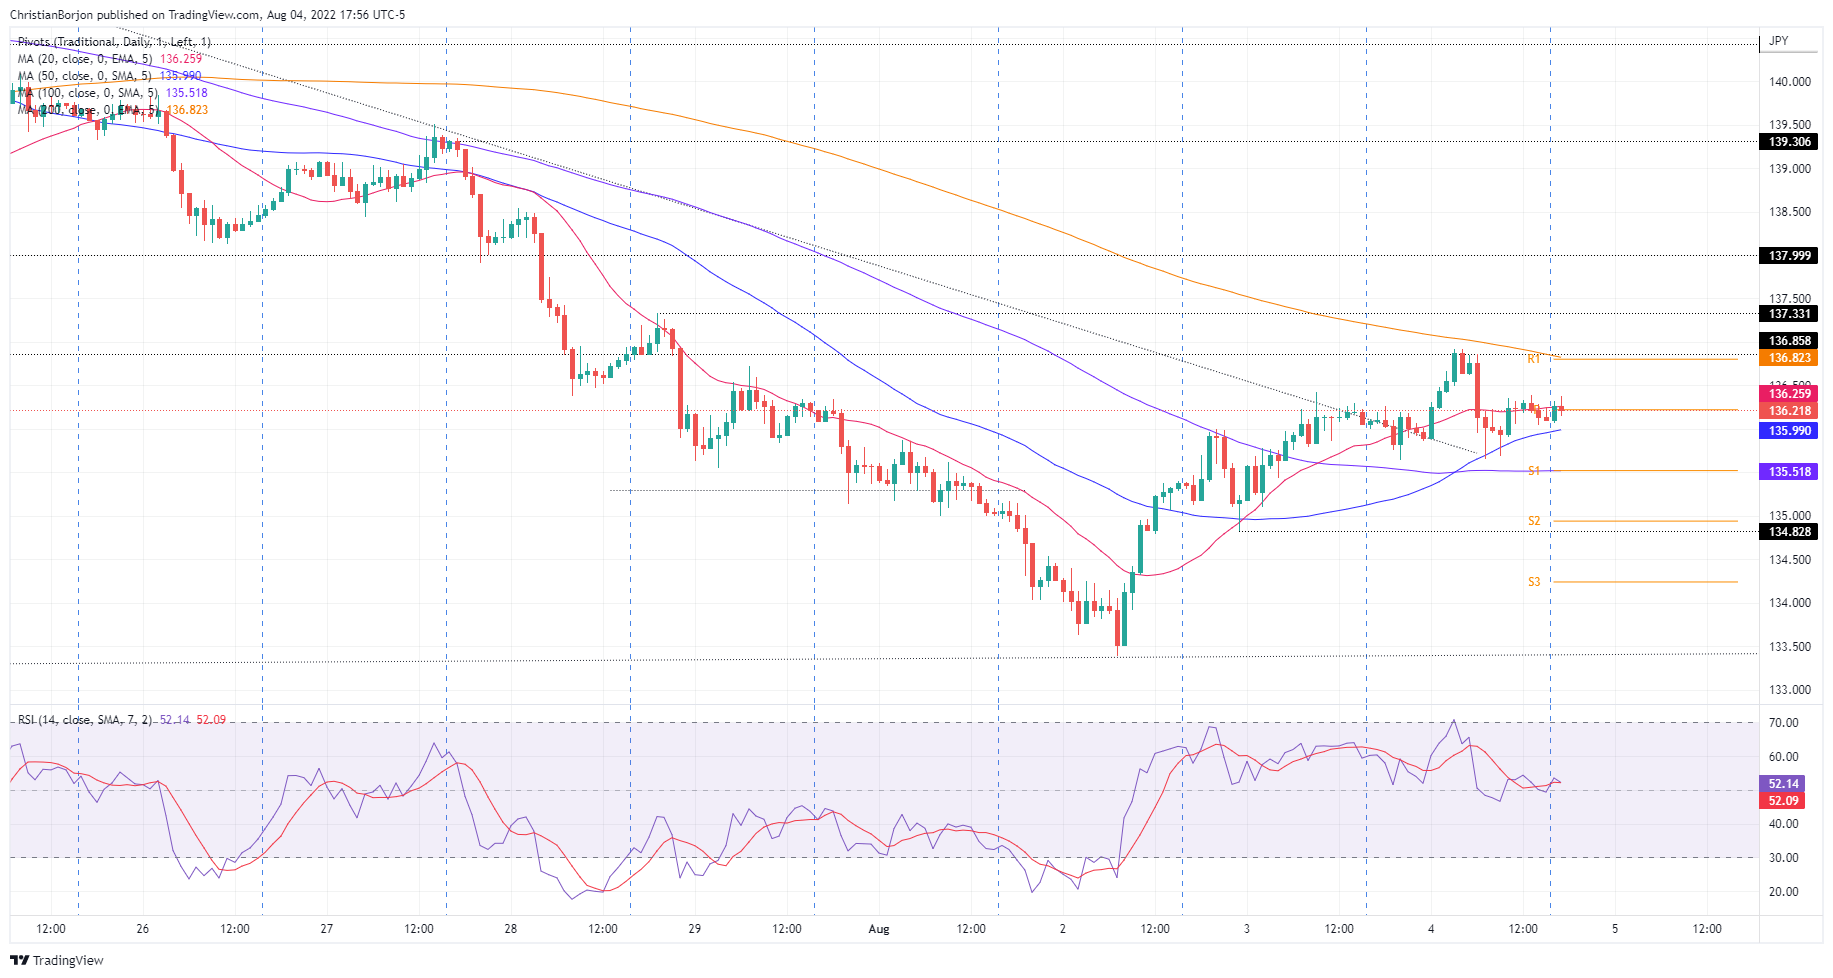
EUR/JPY Hourly chart
The EUR/JPY 1-hour chart depicts price action contracting, trapped between the 200 and the 50-hour EMA, meaning that prices could remain sideways or it’s going to break outside the range. On the upside, the EUR/JPY’s first resistance would be the confluence of the 200-hour EMA and the R1 pivot at 136.82. The break above will expose 137.00, followed by July 27 139.34.
On the flip side, the EUR/JPY first support will be the 50-hour EMA at 135.99. Once cleared, the next support would be the confluence of the 100-hour EMA and the S1 pivot at 135.51, followed by the S2 pivot at 135.00.
EUR/JPY Key Technical Levels