USD/INR Price Analysis: Indian rupee buyers stay hopeful below 79.60 hurdle
- USD/INR pares the biggest daily loss in four months around weekly low.
- Key SMAs, two-week-old resistance line challenge buyers amid bearish MACD signals.
- Weekly horizontal support holds the gate for bear’s entry.
USD/INR picks up bids to 79.22 as traders lick their wounds after the biggest daily fall since early April. Even so, the Indian rupee (INR) pair remains below the key short-term key resistances during early Thursday morning in Europe.
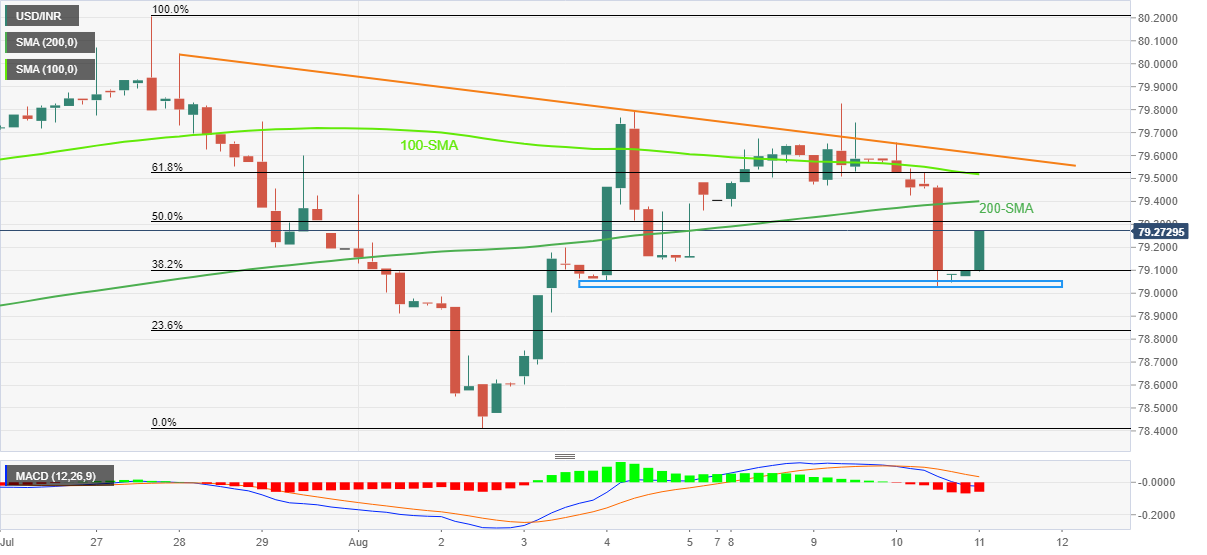
That said, the 50% Fibonacci retracement of the July 27 to August 02 downturn, around 79.30, appears the immediate hurdle for the USD/INR buyers to cross before challenging the 200-SMA level near 79.40.
It should be noted, however, that a convergence of the 200-SMA and 61.8% Fibonacci retracement level around 79.52 appears a strong resistance to watch.
If the quote rises past 79.52, a downward sloping trend line from July 28, near 79.60, acts as the last defense of the USD/INR bears.
On the contrary, the one-week-old horizontal support area surrounding the 79.00 threshold could restrict the immediate downside of the Indian rupee pair. Following that, the monthly low of 78.40 should return to the charts.
In a case where the USD/INR bears keep reins past 78.40, the odds of witnessing the 78.00 round figure back on the screen can’t be ruled out.
USD/INR: Four-hour chart
Trend: Limited recovery expected